- Release notes
- Getting started
- Installation
- Configuration
- Integrations
- Authentication
- Working with Apps and Discovery Accelerators
- AppOne menus and dashboards
- AppOne setup
- TemplateOne 1.0.0 menus and dashboards
- TemplateOne 1.0.0 setup
- TemplateOne menus and dashboards
- TemplateOne 2021.4.0 setup
- Purchase to Pay Discovery Accelerator menus and dashboards
- Purchase to Pay Discovery Accelerator Setup
- Order to Cash Discovery Accelerator menus and dashboards
- Order to Cash Discovery Accelerator Setup
- Basic Connector for AppOne
- SAP Connectors
- Introduction to SAP Connector
- SAP input
- Checking the data in the SAP Connector
- Adding process specific tags to the SAP Connector for AppOne
- Adding process specific Due dates to the SAP Connector for AppOne
- Adding automation estimates to the SAP Connector for AppOne
- Adding attributes to the SAP Connector for AppOne
- Adding activities to the SAP Connector for AppOne
- Adding entities to the SAP Connector for AppOne
- SAP Order to Cash Connector for AppOne
- SAP Purchase to Pay Connector for AppOne
- SAP Connector for Purchase to Pay Discovery Accelerator
- SAP Connector for Order-to-Cash Discovery Accelerator
- Superadmin
- Dashboards and charts
- Tables and table items
- Application integrity
- How to ....
- Working with SQL connectors
- Introduction to SQL connectors
- Setting up a SQL connector
- CData Sync extractions
- Running a SQL connector
- Editing transformations
- Releasing a SQL Connector
- Scheduling data extraction
- Structure of transformations
- Using SQL connectors for released apps
- Generating a cache with scripts
- Setting up a local test environment
- Separate development and production environments
- Useful resources
Procurement - Purchase Requisitions dashboard for analyzing purchase requisition approval processes, with data based on requisition creation dates.
Introduction
Procurement - Purchase requisitions is the main dashboard where you can analyze your process for the purchase requisitions to get approval. See the illustration below.
The information displayed in the dashboard is based on the creation date of the purchase requisitions. The PR creation date filter in the Filters panel enables you to select a period to display the purchase requisitions that were created in the selected period.
Since the process graph displays all purchase requisitions which are created within the selected time period, the graph can also contain changes to these purchase requisitions that might be outside of the selected period.
KPIs
Below is a description of the KPIs that are displayed at the top Procurement - Process requisitions dashboard.
If you click on a KPI, the corresponding metric is selected in the Purchase requisitions dashboard item.
| KPI | Description |
|---|---|
| Avg. throughput time PR approval | The average throughput time from creating the purchase requisition to approval of the purchase requisition. |
| Total value (requested) | The total value of the purchase requisitions. |
| Purchase requisitions | The total number of unique purchase requisitions. |
Purchase Requisitions
With the Purchase requisitions dashboard item you can analyze the purchase requisitions in more detail.
Metrics
You can create various different contexts by selecting different attributes from the drop-down list. The metric selector enables you to select different metrics. Below is a description of the metrics that can be used to analyze the purchase requisitions regarding the selected attribute.
| Metric | Description |
|---|---|
| Number of requisitions | The number of unique purchase requisitions created within the selected period. |
| Percentage of requisitions | The percentage of unique purchase requisitions created within the selected period. |
| Avg. value (requested) | The average of the value of the purchase requisitions created within the selected period related to the selected attribute. |
| Total value (requested) | Sum of the value of the purchase requisitions created within the selected period related to the selected attribute. |
| Avg. number of approvals | The average number of approvals that were performed on purchase requisitions created within the selected period. |
| Avg. throughput time PR approval | Average throughput time of purchase requisitions from creating the purchase requisition to approval of the purchase requisition. |
Distribution
The Distribution chart enables you to analyze the frequency of purchase requisitions based on the Value (requested), the **Number of purchase requisition approvals, or the **Throughput time (PR creation to PR approval). See the illustration below.
The Details button enables you to analyze purchase requisitions in more detail and opens the Details - Purchase requisitions dashboard.
Process graph
The process graph displays the purchase requisition process based on the number of cases. See the illustration below.
You can use the Detail slider to change the number of activities and/or edges shown.
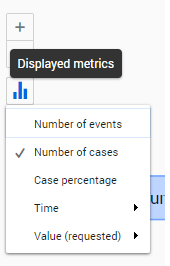
Viewing the process based on a different metric
Follow these steps to select a different metric for the process graph.
| Step | Action |
|---|---|
| 1 | Click on the Displayed metrics icon in the process graph. |
| 2 | Select a different metric from the list of available metrics. |
See the illustration below.
See also Working with Process Graphs.