- Release notes
- Getting started
- Installation
- Configuration
- Integrations
- Authentication
- Working with Apps and Discovery Accelerators
- AppOne menus and dashboards
- AppOne setup
- TemplateOne 1.0.0 menus and dashboards
- TemplateOne 1.0.0 setup
- TemplateOne menus and dashboards
- TemplateOne 2021.4.0 setup
- Purchase to Pay Discovery Accelerator menus and dashboards
- Purchase to Pay Discovery Accelerator Setup
- Order to Cash Discovery Accelerator menus and dashboards
- Order to Cash Discovery Accelerator Setup
- Basic Connector for AppOne
- SAP Connectors
- Introduction to SAP Connector
- SAP input
- Checking the data in the SAP Connector
- Adding process specific tags to the SAP Connector for AppOne
- Adding process specific Due dates to the SAP Connector for AppOne
- Adding automation estimates to the SAP Connector for AppOne
- Adding attributes to the SAP Connector for AppOne
- Adding activities to the SAP Connector for AppOne
- Adding entities to the SAP Connector for AppOne
- SAP Order to Cash Connector for AppOne
- SAP Purchase to Pay Connector for AppOne
- SAP Connector for Purchase to Pay Discovery Accelerator
- SAP Connector for Order-to-Cash Discovery Accelerator
- Superadmin
- Dashboards and charts
- Tables and table items
- Join tables
- Global tables
- Introduction to table items
- Metric selectors
- Contexts
- Example - Adding metrics to AppOne
- Display format
- Maps
- Actions
- Application integrity
- How to ....
- Working with SQL connectors
- Introduction to SQL connectors
- Setting up a SQL connector
- CData Sync extractions
- Running a SQL connector
- Editing transformations
- Releasing a SQL Connector
- Scheduling data extraction
- Structure of transformations
- Using SQL connectors for released apps
- Generating a cache with scripts
- Setting up a local test environment
- Separate development and production environments
- Useful resources
Process Mining user guide
Introduction
Metrics are used to define a calculation once and reuse it in the whole application. This is especially useful in places where it is possible to have a different scope of records. Furthermore, metrics can be used to do the calculation for different aggregations
For example, you can define a metric to calculate the average amount. This metric can then be reused in different places, such as in the size of charts, or in aggregate expressions.
Adding metrics
In AppOne a newly created metric needs to be added in two places before it is available to the end-user.
Each metric is added to a Switch selector expression and, depending on where the metric should be available, you need to modify the corresponding switch expression in one of the following levels:
- Cases
- Events
- Tags
- Due dates
- Events_with_reference_models
- Cases_with_reference_models
For the metric to also be displayed on the dashboard, it needs to be added to the Selector items of the corresponding Selector control.
Example
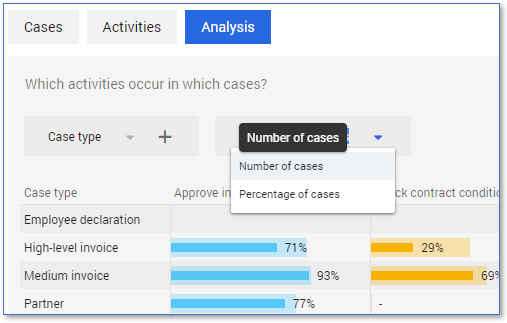
In the example below, a metric Number of users is added to the metric selector of the Process – Process - Analysis dashboard.
See illustration below.

Step 1 Creating the metric
Follow these steps to create a metric.
| Step | Action |
|---|---|
| 1 | Open AppOne in your developer environment and go to the Data tab. |
| 2 | Right-click on the Events table and select the New metric…. |
| 3 | Enter Number of users in the Name field. |
| 4 | Enter Metric_number_of_users in the ID field. |
| 5 | Enter in the editor: count(unique(records.User)) |
| 6 | Click on OK. |
A new metric Number of users is created.
Step 2 Adding the metric to the selector control
Follow these steps to add it to the selector control in the dashboard.
| Step | Action |
|---|---|
| 1 | Go to the Dashboards tab. |
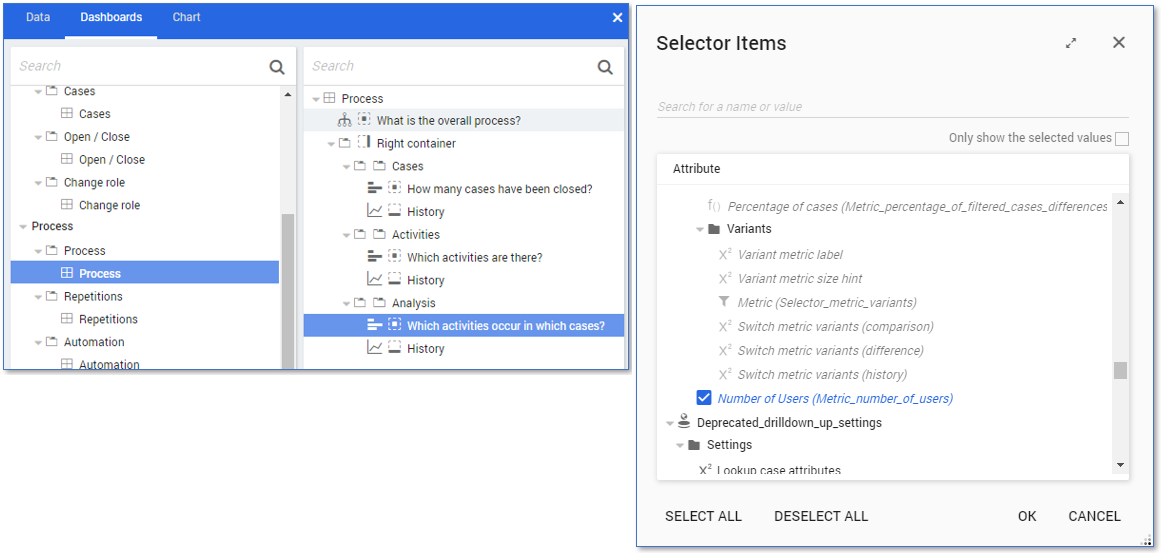
| 2 | Locate the Process menu and click on the chart Which activities occur in which cases? . See illustration below. |
| 3 | Go to the Chart tab. |
| 4 | Double-click on the metric Metric(Selector_metric_filtered_cases) selector in the Header controls of the chart. Note: You can locate this selector by searching for it in the Data tab. |
| 5 | Right-click on the Selector items field and select Add… . |
| 6 | Select the Number of users metric and click on OK . See illustration below. |

The selector now contains the new metric as an option.
Step 3 Adding the metric to the corresponding switch
Switches are expressions that are used to determine which attribute or metric is selected. The new metric must also be added to the metric switches. Follow these steps to add the metric to the corresponding metric switch.
| Step | Action |
|---|---|
| 1 | Go to the Data tab. |
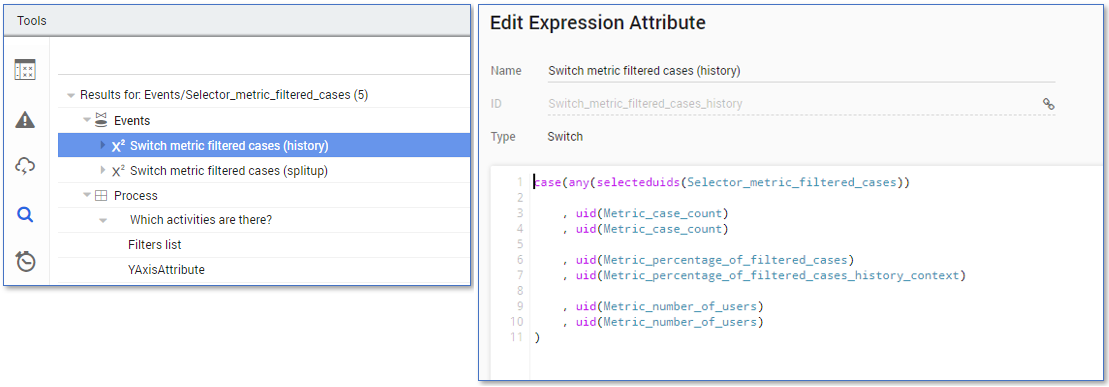
| 2 | Right-click on the Metric Selector_metric_filtered_cases) and select Advanced - Show references…. TheTools panel opens showing all the locations where the selector is used. See illustration below. |
| 3 | Double-click on Switch metric filtered cases (history) to edit the expression. |
| 4 | Add the following lines after the uid(Metric_percentage_of_filtered_cases_comparison) to the Switch metric filtered cases (history): , uid(Metric_number_of_users) , uid(Metric_number_of_users). See illustration below. |
| 5 | Repeat step 3 and 4 for all selectors listed in the Tools panel. |

The new metric is added to the relevant switches.
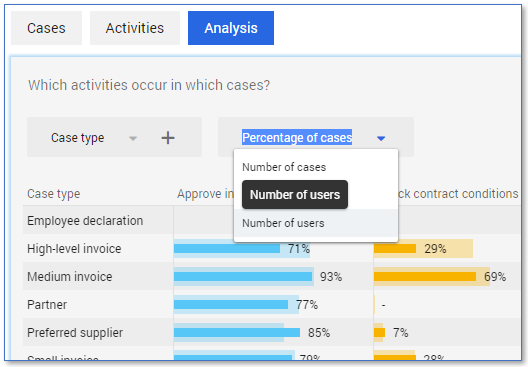
The selector for the Activities and the Analysis dashboards in the Process menu now contains an additional metric. See illustration below.
