- Release notes
- Getting started
- Installation
- Configuration
- Integrations
- Authentication
- Working with Apps and Discovery Accelerators
- AppOne menus and dashboards
- AppOne setup
- TemplateOne 1.0.0 menus and dashboards
- TemplateOne 1.0.0 setup
- TemplateOne menus and dashboards
- TemplateOne 2021.4.0 setup
- Purchase to Pay Discovery Accelerator menus and dashboards
- Purchase to Pay Discovery Accelerator Setup
- Order to Cash Discovery Accelerator menus and dashboards
- Order to Cash Discovery Accelerator Setup
- Basic Connector for AppOne
- SAP Connectors
- Introduction to SAP Connector
- SAP input
- Checking the data in the SAP Connector
- Adding process specific tags to the SAP Connector for AppOne
- Adding process specific Due dates to the SAP Connector for AppOne
- Adding automation estimates to the SAP Connector for AppOne
- Adding attributes to the SAP Connector for AppOne
- Adding activities to the SAP Connector for AppOne
- Adding entities to the SAP Connector for AppOne
- SAP Order to Cash Connector for AppOne
- SAP Purchase to Pay Connector for AppOne
- SAP Connector for Purchase to Pay Discovery Accelerator
- SAP Connector for Order-to-Cash Discovery Accelerator
- Superadmin
- Dashboards and charts
- Tables and table items
- Application integrity
- How to ....
- Working with SQL connectors
- Introduction to SQL connectors
- Setting up a SQL connector
- CData Sync extractions
- Running a SQL connector
- Editing transformations
- Releasing a SQL Connector
- Scheduling data extraction
- Structure of transformations
- Using SQL connectors for released apps
- Generating a cache with scripts
- Setting up a local test environment
- Separate development and production environments
- Useful resources
Process Mining user guide
Introduction
This guide describes how to use the UiPath Process Mining Profiler to analyze the performance of your application. The Profiler can be used to measure the dashboards in your application as well as measuring the load time of your application.
Generate cache
To measure the performance end users of your application will experience, it is recommended to generate a cache before performing a profile run.
Follow these steps to generate a cache.
| Step | Action |
|---|---|
| 1 | Go to the Superadmin Workspaces tab. |
| 2 | Right-click on the application for which you want to profile and select Generate Cache…. |
Overview of icons

The following table describes the icons used for a profile run.
| Icon | Decription |
|---|---|
| A | Displays the Profile pane. |
| B | Starts a new profiles run. |
| C | Reloads your application. |
| D | Aborts the profile run. |
Starting the Profiler for an ad-hoc run
The Profiler needs to be started from within an application.
Follow these steps to start an ad-hoc profile run.
| Step | Action |
|---|---|
| 1 | Go to the Superadmin Workspaces tab and double click on the application you want to profile. |
| 2 | Open the Tools panel. |
| 3 | Click on the timing icon (A) to the display the Profile pane. |
| 4 | Click on the start icon (B) to start profiling. |
| 5 | Perform the actions in your application that you want to measure. |
| 6 | When finished, click on the stop icon (D) to stop profiling. |
The Profiler records initialization timings of the application, including dashboards, charts and attributes. The Profiler application will help you to investigate what aspect of your application takes what amount of time.
Profiling the oad Ttme of an application
Follow these steps to measure the time it takes for your application to load.
| Step | Action |
|---|---|
| 1 | Open the Tools panel. |
| 2 | Click on the timing icon (A) to the display the Profile pane. |
| 3 | Click on the reload icon (C) to reload our application. A profile run is automatically started. |
| 4 | Wait until all dashboard items are fully loaded. |
| 5 | Click on the stop icon (D) to stop profiling. |
This profile run includes all timings related to the start-up of your application.
Viewing the results of a Profile run
Follow these steps view the results of a profile run.
| Step | Action |
|---|---|
| 1 | Open the Tools panel. |
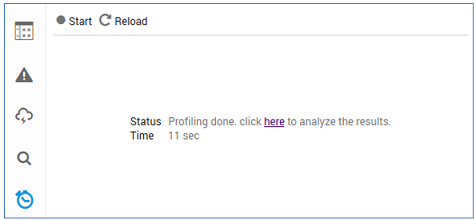
| 2 | Click on the link in the Results panel. See illustration below. |

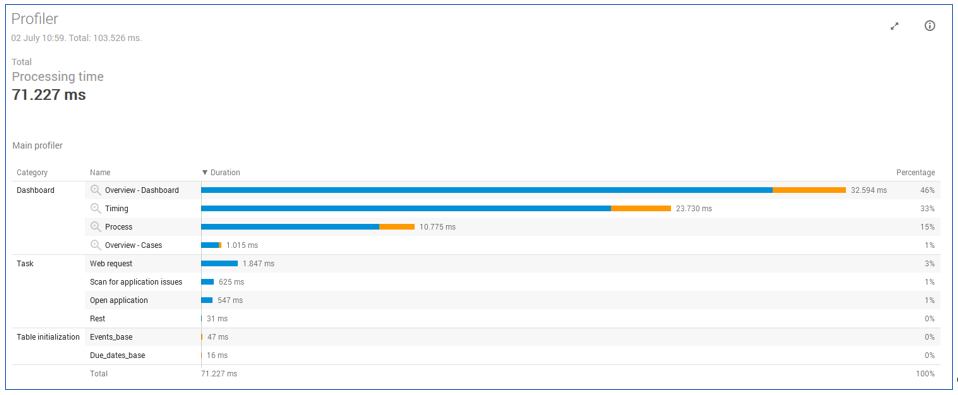
After a profiling run, the Profiler app opens automatically in a new tab of your browser. See illustration below.
