- Release notes
- Getting started
- Installation
- Configuration
- Integrations
- Authentication
- Working with Apps and Discovery Accelerators
- AppOne menus and dashboards
- AppOne setup
- TemplateOne 1.0.0 menus and dashboards
- TemplateOne 1.0.0 setup
- TemplateOne menus and dashboards
- TemplateOne 2021.4.0 setup
- Purchase to Pay Discovery Accelerator menus and dashboards
- Purchase to Pay Discovery Accelerator Setup
- Order to Cash Discovery Accelerator menus and dashboards
- Order to Cash Discovery Accelerator Setup
- Basic Connector for AppOne
- SAP Connectors
- Introduction to SAP Connector
- SAP input
- Checking the data in the SAP Connector
- Adding process specific tags to the SAP Connector for AppOne
- Adding process specific Due dates to the SAP Connector for AppOne
- Adding automation estimates to the SAP Connector for AppOne
- Adding attributes to the SAP Connector for AppOne
- Adding activities to the SAP Connector for AppOne
- Adding entities to the SAP Connector for AppOne
- SAP Order to Cash Connector for AppOne
- SAP Purchase to Pay Connector for AppOne
- SAP Connector for Purchase to Pay Discovery Accelerator
- SAP Connector for Order-to-Cash Discovery Accelerator
- Superadmin
- Dashboards and charts
- Tables and table items
- Application integrity
- How to ....
- Working with SQL connectors
- Introduction to SQL connectors
- Setting up a SQL connector
- CData Sync extractions
- Running a SQL connector
- Editing transformations
- Releasing a SQL Connector
- Scheduling data extraction
- Structure of transformations
- Using SQL connectors for released apps
- Generating a cache with scripts
- Setting up a local test environment
- Separate development and production environments
- Useful resources
Process Mining user guide
Introduction
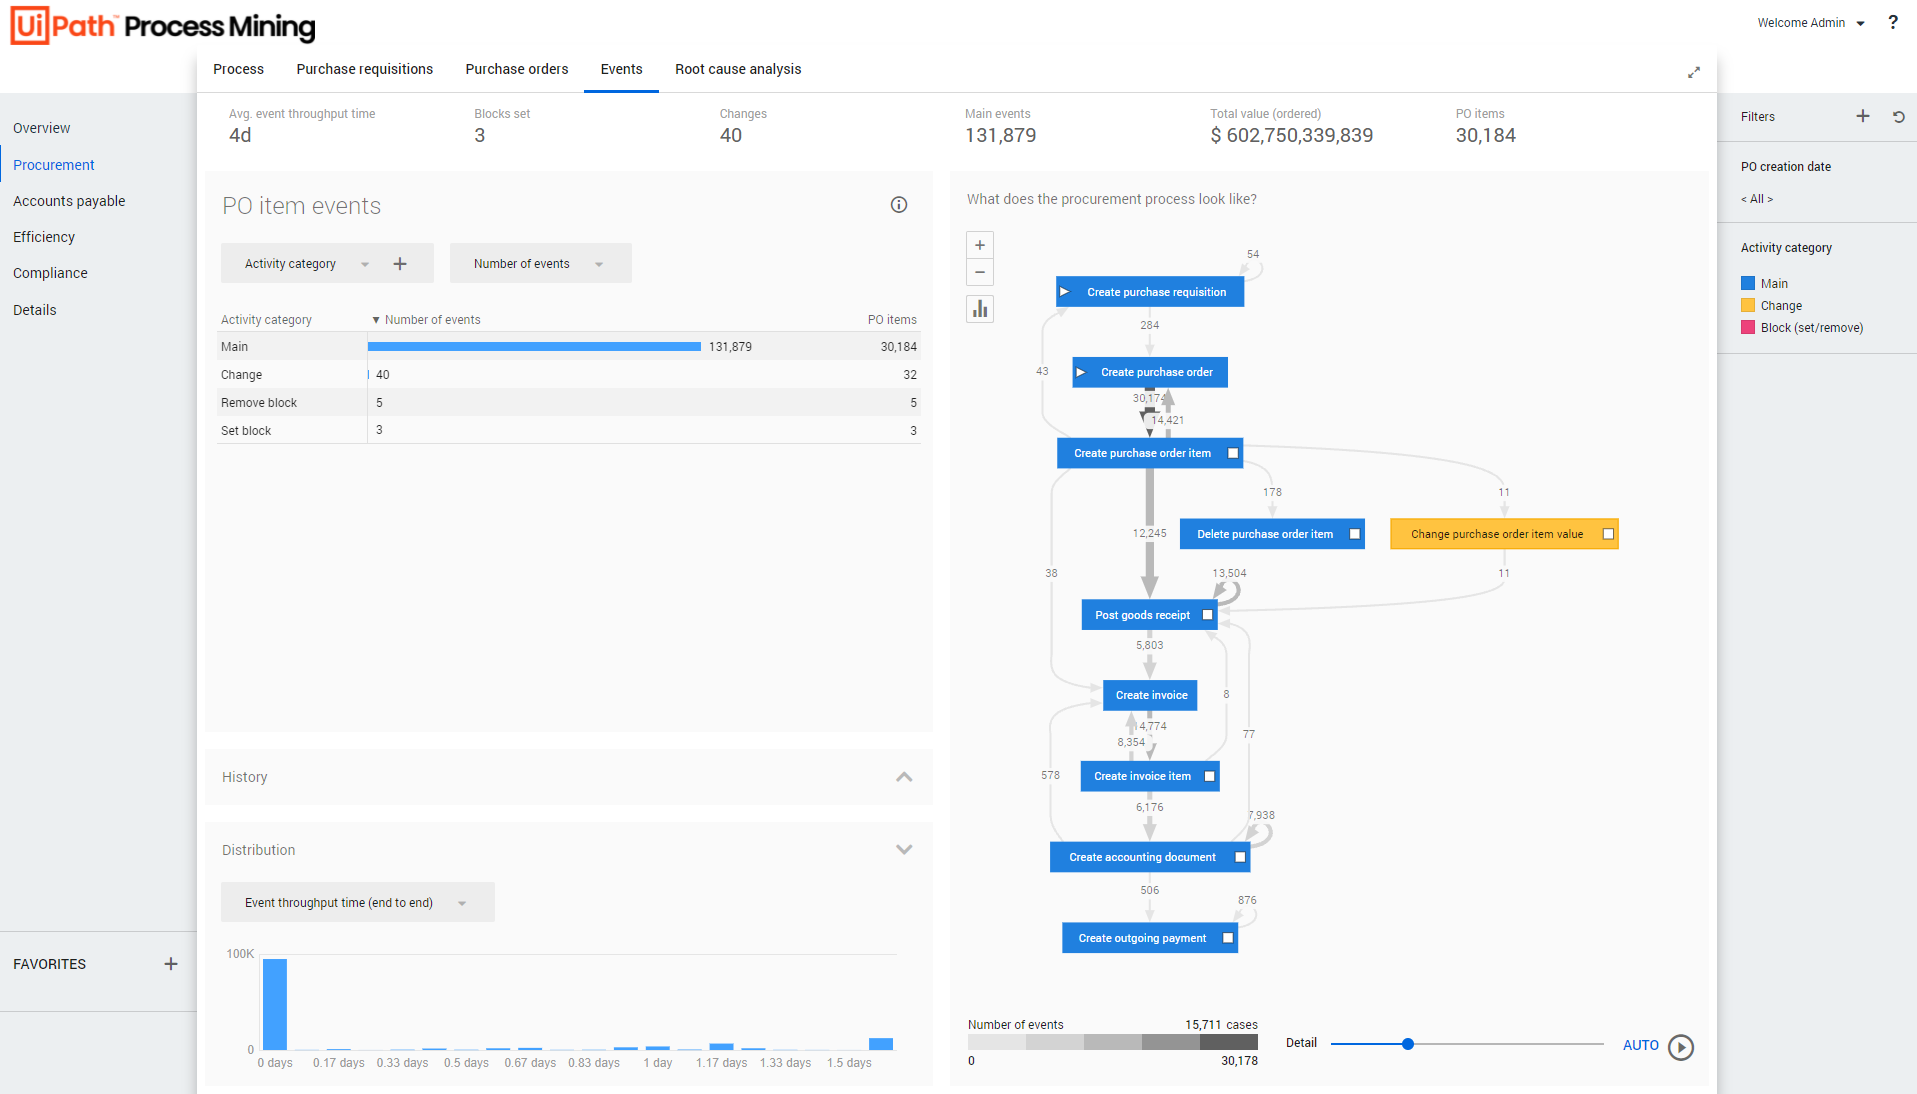
Procurement - Events is the main dashboard where you can analyze the events that take place in the Purchase-to-Pay process regarding purchase order items. Block or change events are regarded as deviations. These are events that you would ideally not want to happen. See the illustration below.

The information displayed in the dashboard is based on the creation date of the purchase order items. The PO creation date filter in the Filters panel enables you to select a period to display the purchase order items that were created in the selected period.
Since the process graph displays all purchase order items which are created within the selected period, the graph can also contain changes to these purchase order items that might be outside the selected period.
Timestamps
Throughput time is the duration between the event end timestamps of two events which follow each other. In this case, waiting time and idle time are also calculated. Processing time is the time actually spent on the event. In this case, waiting time and idle time are not taken in to account.
KPIs
Below is a description of the KPIs that are displayed at the top Procurement - Events dashboard.
| KPI | Description |
|---|---|
| Avg. event throughput time | The average event throughput time for purchase order item events. Note: If you click on the |
| Blocks set | The total number of block (set) events on purchase order items. Note: If you click on the |
| Changes | The total number of change events on purchase order items. Note: If you click on the |
| Main events | The total number of main events on purchase order items. Note: If you click on the |
| Total value (ordered) | The total value of the purchase order items. |
| PO items | The total number of unique purchase order items. |
PO Item Events
With the PO item events dashboard item you can analyze the Purchase order items in more detail.
Metrics
You can create various different contexts by selecting different attributes from the drop-down list. The metric selector enables you to select different metrics. Below is a description of the metrics that can be used to analyze the purchase order item events regarding the selected attribute.
| Metric | Description |
|---|---|
| Number of events | The number of unique events, for purchase order items created within the selected period. |
| Avg. number of events | The average number of events that were performed on purchase order items that were within the selected period. |
| Percentage of events | The percentage of unique events for purchase order items created within the selected period, related to the number of purchase order items. |
| Percentage of items | The percentage of purchase order items per category, compared to unique purchase order items of all categories, for purchase order items created within the selected period. |
| Avg. event cost | The average cost of executing events for purchase order items created within the selected period. |
| Total event cost | The total costs of executing events, for purchase order item created within the selected period. |
| Avg. event processing time | The average processing time of events for purchase order items created within the selected period. |
| Total event processing time | The total processing time of event for purchase order items created within the selected period. |
| Avg. event throughput time | The average throughput time of all events for purchase order items created within the selected period. |
| Total event throughput time | The total throughput time of all events for purchase order items created within the selected period. |
Distribution
The event throughput time is the difference between the event of the current event and the event end of the previous event. The Distribution chart enables you to analyze the frequency of events based on the **Event throughput time (end to end). See the illustration below.

The Details button enables you to analyze purchase order items in more detail and opens the Details - PO items dashboard.
Process graph
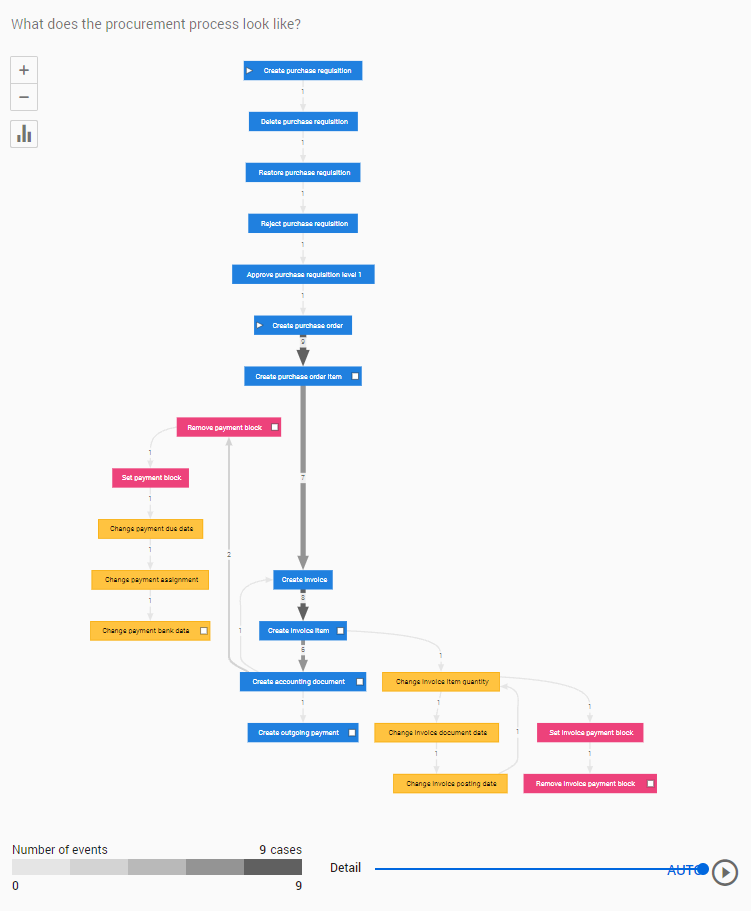
The process graph displays the procurement process based on the number of events. See the illustration below.

You can use the Detail slider to change the number of activities and/or edges shown.
Viewing the process based on a different metric
Follow these steps to select a different metric for the process graph.
| Step | Action |
|---|---|
| 1 | Click on the Displayed metrics icon in the process graph. |
| 2 | Select a different metric from the list of available metrics. |
See the illustration below.

See also Working with Process Graphs.
Activity category legend
The colors of the activities in the process correspond to the different event categories. See the illustration below.
