- Release notes
- Getting started
- Installation
- Configuration
- Integrations
- Authentication
- Working with Apps and Discovery Accelerators
- AppOne menus and dashboards
- AppOne setup
- TemplateOne 1.0.0 menus and dashboards
- TemplateOne 1.0.0 setup
- TemplateOne menus and dashboards
- TemplateOne 2021.4.0 setup
- Purchase to Pay Discovery Accelerator menus and dashboards
- Purchase to Pay Discovery Accelerator Setup
- Order to Cash Discovery Accelerator menus and dashboards
- Order to Cash Discovery Accelerator Setup
- Basic Connector for AppOne
- SAP Connectors
- Introduction to SAP Connector
- SAP input
- Checking the data in the SAP Connector
- Adding process specific tags to the SAP Connector for AppOne
- Adding process specific Due dates to the SAP Connector for AppOne
- Adding automation estimates to the SAP Connector for AppOne
- Adding attributes to the SAP Connector for AppOne
- Adding activities to the SAP Connector for AppOne
- Adding entities to the SAP Connector for AppOne
- SAP Order to Cash Connector for AppOne
- SAP Purchase to Pay Connector for AppOne
- SAP Connector for Purchase to Pay Discovery Accelerator
- SAP Connector for Order-to-Cash Discovery Accelerator
- Superadmin
- Dashboards and charts
- Tables and table items
- Application integrity
- How to ....
- Working with SQL connectors
- Introduction to SQL connectors
- Setting up a SQL connector
- CData Sync extractions
- Running a SQL connector
- Editing transformations
- Releasing a SQL Connector
- Scheduling data extraction
- Structure of transformations
- Using SQL connectors for released apps
- Generating a cache with scripts
- Setting up a local test environment
- Separate development and production environments
- Useful resources
Process Mining user guide
Introduction
In Process Mining, tags are the business rules you apply to your data, for example, multiple final checks needed, payment info not clear, and more. The Compliance – Tags dashboard can be used to analyze the tags that occur. It displays what the process looks like for each of these individual tags, and enables you to analyze in more detail where the tags occur in the process, who was involved and so on. See the illustration below.
If you want to use the Compliance - Tags dashboard to analyze tags, the attributes for the Tags table must be loaded in TemplateOne. See Input tables of TemplateOne - Tags.
Context information
The context bar at the top of the Compliance - Tags dashboard displays context information and KPI's.
Below is a description of the elements of the context bar.
| Element | Description |
|---|---|
| Percentage of cases with tag | The percentage of cases that have a tag assigned. |
| Average throughput time cases with tag | The average throughput time for cases that have a tag assigned. |
| Total case value cases with tags | The total value of all cases that have a tag assigned. |
| Number of cases with tag | The total number of cases that have a tag assigned. |
Which tags occur?
You can create various different contexts by selecting different groupings from the drop-down list. The metric selector enables you to select different metrics. See the illustration below.
Below is a description of the metrics that can be used to analyze the cases regarding tags.
| Metric | Description |
|---|---|
| Number of cases with tag | The number of cases that have a tag assigned. |
| Percentage of cases with tag | The percentage of cases that have a tag assigned related to the number of cases. |
| Avg case value cases with tag | The average value of the cases that have a tag assigned. |
| Total case value cases with tag | The total value of all cases that have a tag assigned. |
| Avg throughput time cases with tag | The average throughput time of the cases that have a tag assigned. |
| Total throughput time cases with tag | The total throughput time of the cases that have a tag assigned. |
| Median throughput time cases with tag | The median throughput time of the cases that have a tag assigned. |
Process graph
The process graph displays the process for cases that have tags based on the number of cases that have tags assigned.
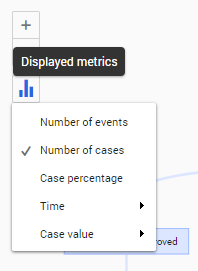
Viewing the process based on a different metric
Follow these steps to select a different metric for the process graph.
| Step | Action |
|---|---|
| 1 | Click on the Displayed metrics icon in the process graph. |
| 2 | Select a different metric from the list of available metrics. |
See the illustration below for an example.
You can use the Detail slider to change the number of activities and/or edges shown.
See also Working with Process Graphs.