process-mining
2021.10
true
- 发行说明
- 入门指南
- 安装
- 配置
- 集成
- 身份验证
- Working with Apps and Discovery Accelerators
- AppOne 菜单和仪表板
- AppOne 设置
- TemplateOne 1.0.0 菜单和仪表板
- TemplateOne 1.0.0 设置
- TemplateOne menus and dashboards
- TemplateOne 2021.4.0 设置
- Purchase to Pay Discovery Accelerator 菜单和仪表板
- 购买到付款 Discovery Accelerator 设置
- Order to cash Discovery Accelerator 菜单和仪表板
- “订单到现金” Discovery Accelerator 设置
- Basic Connector for AppOne
- SAP Connectors
- 适用于 AppOne 的 SAP 订单到现金连接器
- 适用于 AppOne 的 SAP 采购到付款连接器
- SAP Connector for Purchase to Pay Discovery Accelerator
- SAP Connector for Order-to-Cash Discovery Accelerator
- Superadmin
- 仪表板和图表
- 表格和表格项目
- 应用程序完整性
- How to ....
- 使用 SQL 连接器
- Introduction to SQL connectors
- Setting up a SQL connector
- CData Sync extractions
- Running a SQL connector
- Editing transformations
- 释放 SQL 连接器
- Scheduling data extraction
- Structure of transformations
- Using SQL connectors for released apps
- Generating a cache with scripts
- Setting up a local test environment
- Separate development and production environments
- 实用资源
重要 :
请注意,此内容已使用机器翻译进行了部分本地化。
新发布内容的本地化可能需要 1-2 周的时间才能完成。

Process Mining 用户指南
上次更新日期 2026年4月23日
分析 - 端到端
简介
Analysis - End to end is the dashboard where you can analyze the complete process regarding cases.
请参见下图。
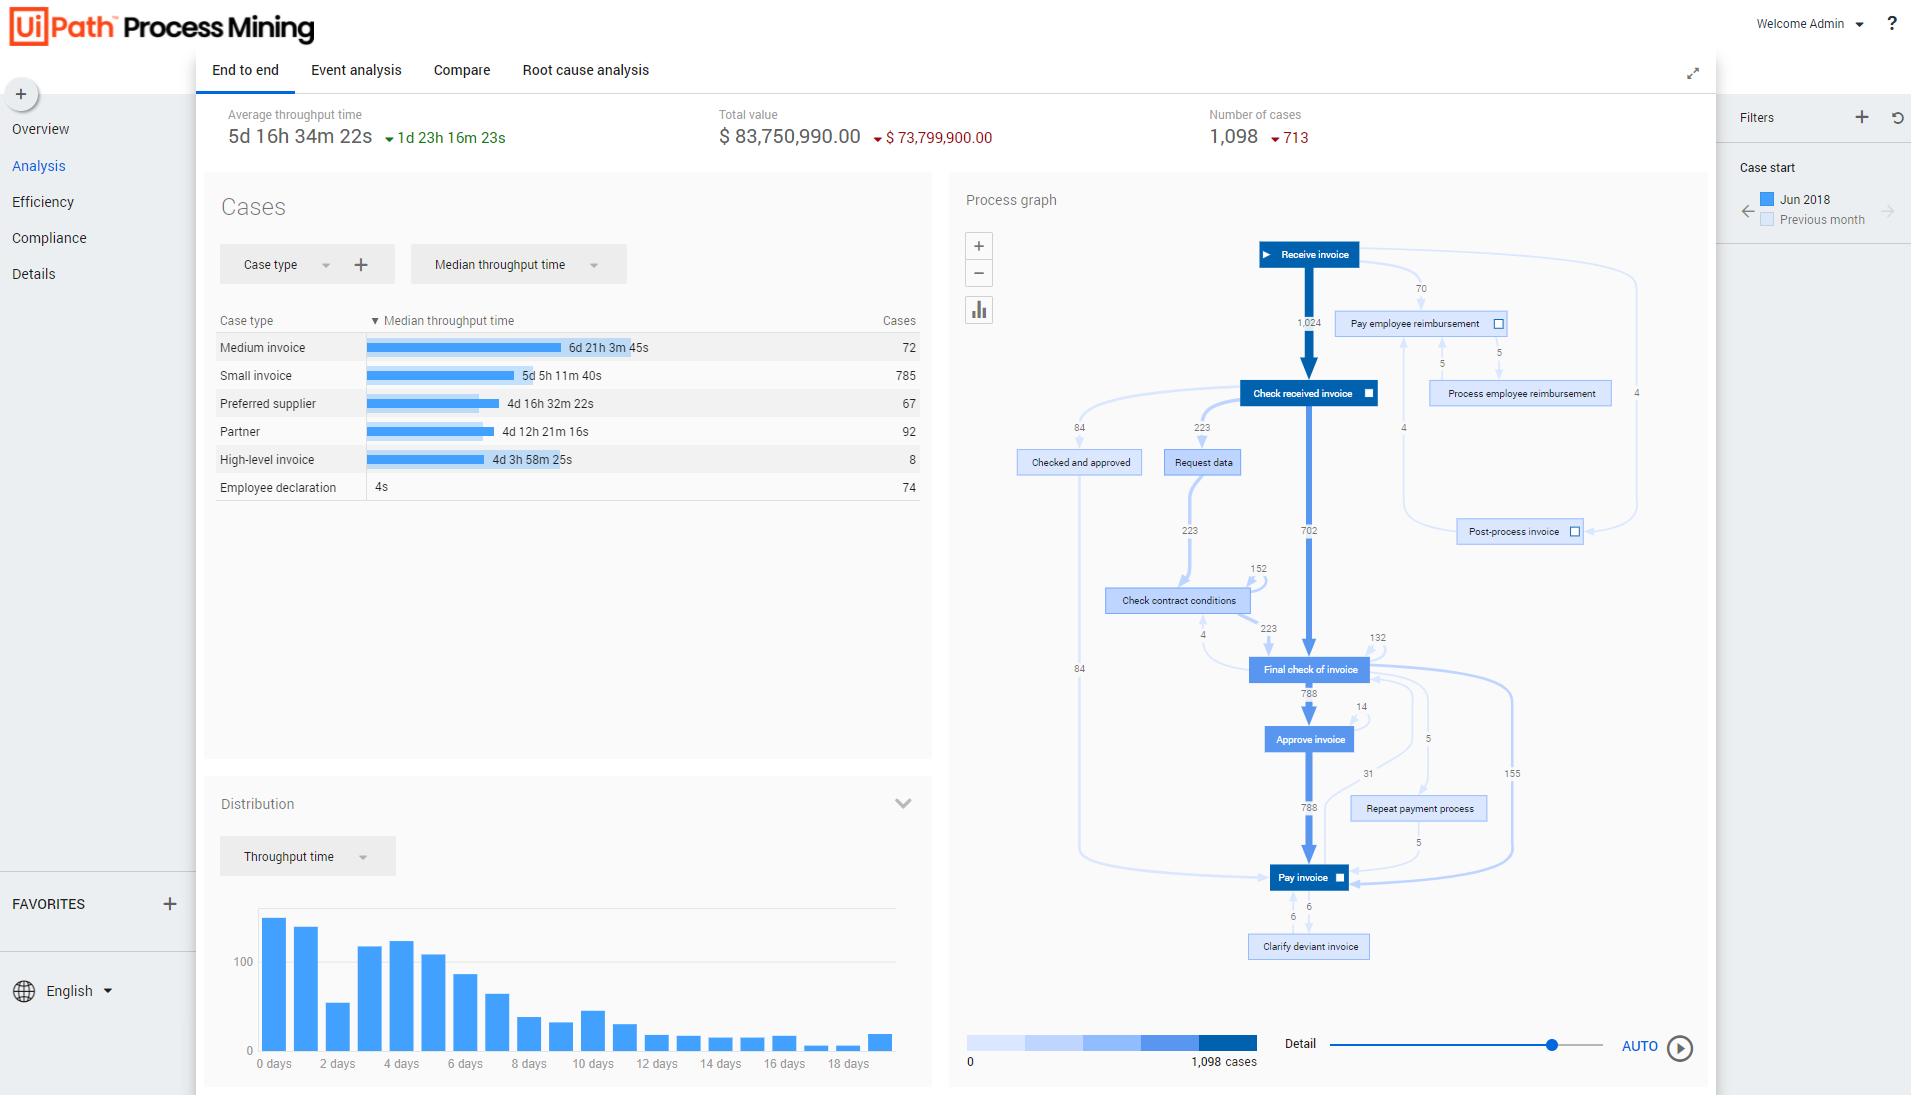
上下文信息
The context bar at the top of the Analysis - End to end dashboard displays context information and KPI's.
以下是上下文栏元素的说明。
| 元素 | 描述 |
|---|---|
| 平均吞吐时间 | 端到端流程的平均吞吐时间。 |
| 总值 | 案例的总值。 |
| 案例数 | 案例总数。 |
case 子句
The Cases dashboard item enables you to select various attributes and metrics to analyze cases.
Below is a description of the metrics that can be selected in the Cases dashboard item.
| 指标 | 描述 |
|---|---|
| 案例数 | 在选定期间创建的唯一案例数。 |
| 案例百分比 | 在选定期间创建的案例百分比。 |
| 平均案例值 | 在选定期间创建的案例的平均案例值。 |
| 总案例值 | 所选期间创建的案例的值的总和。 |
| 平均吞吐时间 | 端到端流程的平均吞吐时间。 |
| 总吞吐时间 | 端到端流程的总吞吐时间。 |
| 吞吐时间中值 | 端到端流程的吞吐时间中值。 |
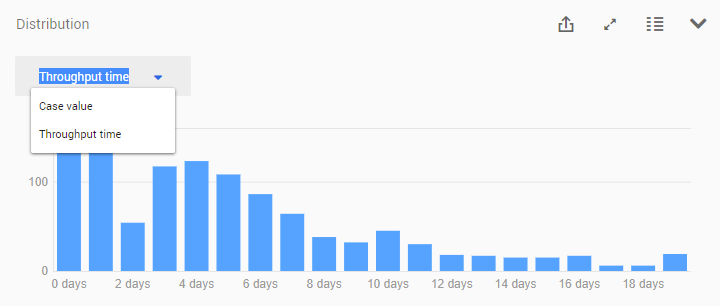
分布
The Distribution chart enables you to analyze the frequency of cases based on Case value or Throughput time. See the illustration below.
流程图
流程图会根据案例的数量显示端到端流程。请参见下图。
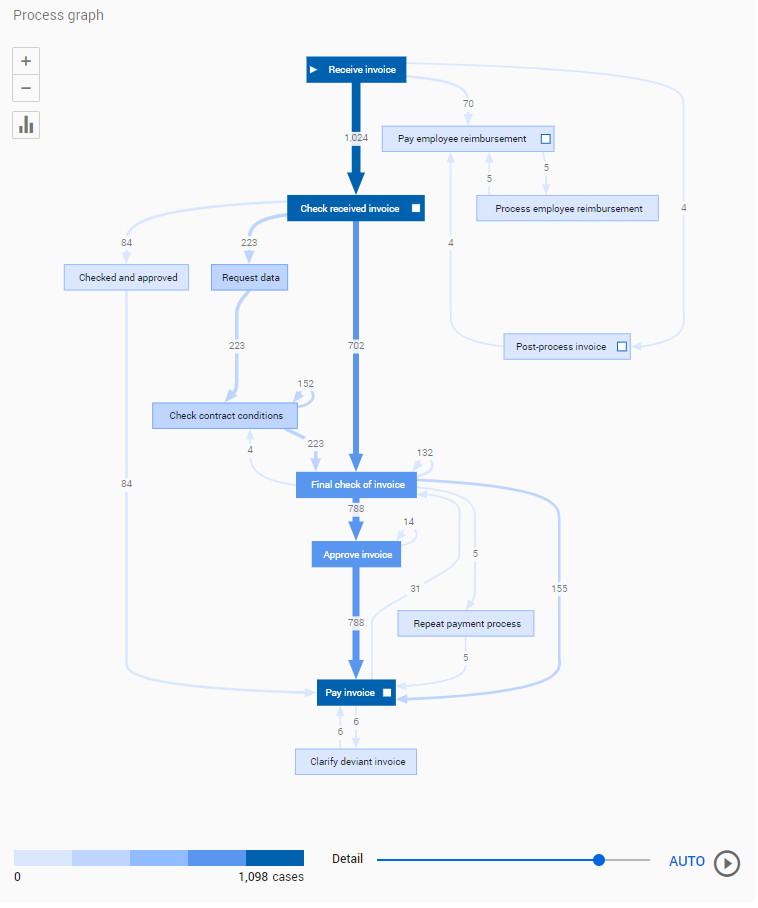
备注:
您可以使用“详细信息”滑块更改显示的活动和/或边线的数量。
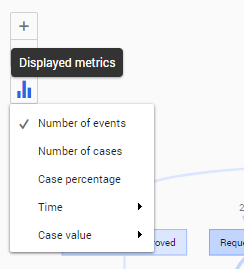
根据不同的指标查看流程
请按照以下步骤为流程图选择其他指标。
| 步骤 | 操作 |
|---|---|
| 1 | Click on the Displayed metrics icon in the process graph. |
| 2 | 从可用指标列表中选择其他指标。 |
有关示例,请参见下图。