- 发行说明
- 入门指南
- 安装
- 配置
- 集成
- 身份验证
- Working with Apps and Discovery Accelerators
- AppOne 菜单和仪表板
- AppOne 设置
- TemplateOne 1.0.0 菜单和仪表板
- TemplateOne 1.0.0 设置
- TemplateOne menus and dashboards
- TemplateOne 2021.4.0 设置
- Purchase to Pay Discovery Accelerator 菜单和仪表板
- 购买到付款 Discovery Accelerator 设置
- Order to cash Discovery Accelerator 菜单和仪表板
- “订单到现金” Discovery Accelerator 设置
- Basic Connector for AppOne
- SAP Connectors
- 适用于 AppOne 的 SAP 订单到现金连接器
- 适用于 AppOne 的 SAP 采购到付款连接器
- SAP Connector for Purchase to Pay Discovery Accelerator
- SAP Connector for Order-to-Cash Discovery Accelerator
- Superadmin
- 仪表板和图表
- 表格和表格项目
- 应用程序完整性
- How to ....
- 使用 SQL 连接器
- Introduction to SQL connectors
- Setting up a SQL connector
- CData Sync extractions
- Running a SQL connector
- Editing transformations
- 释放 SQL 连接器
- Scheduling data extraction
- Structure of transformations
- Using SQL connectors for released apps
- Generating a cache with scripts
- Setting up a local test environment
- Separate development and production environments
- 实用资源
自动化商机概述仪表板,显示当前和之前期间的自动化率,以及事件执行成本。
简介
The dashboard Overview – Automation can be used to find automation opportunities in the process. For the selected attribute the Automation rate is displayed for the current and the previous period. The dashboard also displays information about the costs involved in the execution of an event which indicates the benefit of automating the event. See illustration below.
In stead of the Automation rate, you can select the Manual event cost, or the Manual processing time as the main metric to be displayed on the dashboard. See illustration below.
History graph
The History graph shows the metric values for the selected attribute over time. See illustration below.
以下是不同指标的说明。
| 指标 | 描述 |
|---|---|
| 手动处理时间 | 人员实际为事件工作的时间。 |
| 手动事件成本 | 表示执行事件的成本。 |
| 自动化率 | 已自动化的事件百分比。 |
| 手动事件 | 未自动化的事件数。 |
| 事件总数 | 事件评论总数。 |
流程图
流程图提供与流程中案例数量相关的事件成本的可视化表示。将鼠标指针悬停在活动上时,指标将在提示中显示。请参见下图。
将鼠标悬停在边缘上时,提示中会显示平均吞吐量时间和事件数。 请参见下图。
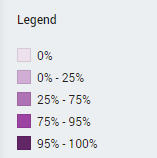
Automation legend
流程中活动的颜色与每个活动的自动化事件百分比相对应。 请参见下图。