UiPath を使用したエージェンティック オートメーションとオーケストレーションについて学ぶ
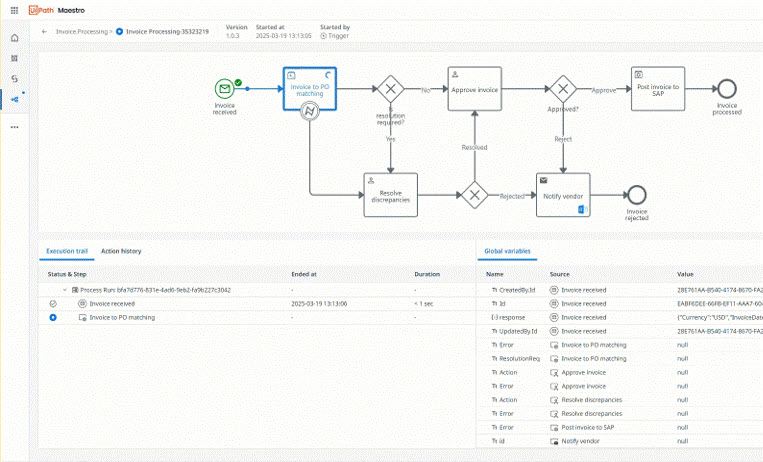
Maestro
AI エージェント、オートメーション、そして人をエンドツーエンドのプロセス全体でオーケストレーションし、測定可能な成果を実現する
UiPath の利用を開始する
基本のエンドツーエンドのプロセスを構築する
エンドツーエンドの業務プロセスを 1 つのワークフローでオーケストレーションする
シンプルな RPA オートメーションを作成する
Studio で最初のプロジェクトを作成する
はじめてのエージェントを構築する
Studio Web ではじめてのエージェントを構築する
会話型エージェントを構築する
Studio Web のローコード デザイナーを使用して会話型エージェントを作成する
コネクタ
コネクタによる、外部システムへの安全で標準化されたアクセス方法について学ぶ
人気のトピック
ファイアウォールを構成する
Automation Cloud に必要なネットワーク トラフィックを許可する
Studio をインストールする
マシンに Studio をインストールする
Studio のチュートリアル
はじめてのオートメーションをステップ バイ ステップで構築する
データ所在地
Automation Cloud のデータの保存場所を選択する
Studio Web の概要
ブラウザーでオートメーションを作成して実行する
更新内容
業種別・部門別ソリューション ガイドの公開
業種別のエージェンティック ソリューション
会話型エージェントの新しいデプロイ チャネル
会話型エージェントを Microsoft Teams と Slack にデプロイする
Integration Service のコネクションの Orchestrator への移動
Integration Service connections are now available in Orchestrator
Document Understanding のトレーニング可能な分割器
トレーニング可能な ML モデルを使用してマルチドキュメント パケットを分割および分類する
Automation Suite の新しいエージェンティック機能
Agents、Maestro、MCP サーバーが Automation Suite で利用可能に