- Overview
- Requirements
- Deployment templates
- Manual: Preparing the installation
- Manual: Preparing the installation
- Step 2: Configuring the OCI-compliant registry for offline installations
- Step 3: Configuring the external objectstore
- Step 4: Configuring High Availability Add-on
- Step 5: Configuring SQL databases
- Step 6: Configuring the load balancer
- Step 7: Configuring the DNS
- Step 8: Configuring the disks
- Step 9: Configuring kernel and OS level settings
- Step 10: Configuring the node ports
- Step 11: Applying miscellaneous settings
- Step 12: Validating and installing the required RPM packages
- Step 13: Generating cluster_config.json
- Certificate configuration
- Database configuration
- External Objectstore configuration
- Pre-signed URL configuration
- Kerberos authentication configuration
- External OCI-compliant registry configuration
- Disaster recovery: Active/Passive and Active/Active configurations
- High Availability Add-on configuration
- Orchestrator-specific configuration
- Insights-specific configuration
- Process Mining-specific configuration
- Document Understanding-specific configuration
- Automation Suite Robots-specific configuration
- Monitoring configuration
- Optional: Configuring the proxy server
- Optional: Enabling resilience to zonal failures in a multi-node HA-ready production cluster
- Optional: Passing custom resolv.conf
- Optional: Increasing fault tolerance
- install-uipath.sh parameters
- Adding a dedicated agent node with GPU support
- Adding a dedicated agent Node for Task Mining
- Connecting Task Mining application
- Adding a Dedicated Agent Node for Automation Suite Robots
- Step 15: Configuring the temporary Docker registry for offline installations
- Step 16: Validating the prerequisites for the installation
- Manual: Performing the installation
- Post-installation
- Cluster administration
- Managing products
- Getting Started with the Cluster Administration portal
- Migrating objectstore from persistent volume to raw disks
- Migrating from in-cluster to external High Availability Add-on
- Migrating data between objectstores
- Migrating in-cluster objectstore to external objectstore
- Migrating from in-cluster registry to an external OCI-compliant registry
- Switching to the secondary cluster manually in an Active/Passive setup
- Disaster Recovery: Performing post-installation operations
- Converting an existing installation to multi-site setup
- Guidelines on upgrading an Active/Passive or Active/Active deployment
- Guidelines on backing up and restoring an Active/Passive or Active/Active deployment
- Redirecting traffic for the unsupported services to the primary cluster
- Scaling a single-node (evaluation) deployment to a multi-node (HA) deployment
- Monitoring and alerting
- Migration and upgrade
- Step 1: Moving the Identity organization data from standalone to Automation Suite
- Step 2: Restoring the standalone product database
- Step 3: Backing up the platform database in Automation Suite
- Step 4: Merging organizations in Automation Suite
- Step 5: Updating the migrated product connection strings
- Step 6: Migrating standalone Orchestrator
- Step 7: Migrating standalone Insights
- Step 8: Migrating standalone Test Manager
- Step 9: Deleting the default tenant
- Performing a single tenant migration
- Migrating from Automation Suite on Linux to Automation Suite on EKS/AKS
- Upgrading Automation Suite
- Downloading the installation packages and getting all the files on the first server node
- Retrieving the latest applied configuration from the cluster
- Updating the cluster configuration
- Configuring the OCI-compliant registry for offline installations
- Executing the upgrade
- Performing post-upgrade operations
- Product-specific configuration
- Using the Orchestrator Configurator Tool
- Configuring Orchestrator parameters
- Orchestrator appSettings
- Configuring appSettings
- Configuring the maximum request size
- Overriding cluster-level storage configuration
- Configuring credential stores
- Configuring encryption key per tenant
- Cleaning up the Orchestrator database
- Best practices and maintenance
- Troubleshooting
- How to troubleshoot services during installation
- How to uninstall the cluster
- How to clean up offline artifacts to improve disk space
- How to clear Redis data
- How to enable Istio logging
- How to manually clean up logs
- How to clean up old logs stored in the sf-logs bucket
- How to disable streaming logs for AI Center
- How to debug failed Automation Suite installations
- How to delete images from the old installer after upgrade
- How to disable TX checksum offloading
- How to upgrade from Automation Suite 2022.10.10 and 2022.4.11 to 2023.10.2
- How to manually set the ArgoCD log level to Info
- How to expand AI Center storage
- How to generate the encoded pull_secret_value for external registries
- How to address weak ciphers in TLS 1.2
- How to work with certificates
- How to forward application logs to Splunk
- How to clean up unused Docker images from registry pods
- How to collect DU usage data with in-cluster objectstore (Ceph)
- How to install RKE2 SELinux on air-gapped environments
- How to clean up old differential backups on an NFS server
- Unable to run an offline installation on RHEL 8.4 OS
- Error in downloading the bundle
- Offline installation fails because of missing binary
- Certificate issue in offline installation
- First installation fails during Longhorn setup
- SQL connection string validation error
- Prerequisite check for selinux iscsid module fails
- Azure disk not marked as SSD
- Failure after certificate update
- Antivirus causes installation issues
- Automation Suite not working after OS upgrade
- Automation Suite requires backlog_wait_time to be set to 0
- Volume unable to mount due to not being ready for workloads
- Support bundle log collection failure
- Test Automation SQL connection string is ignored
- DNS settings not honored by CoreDNS
- Data loss when reinstalling or upgrading Insights following Automation Suite upgrade
- Single-node upgrade fails at the fabric stage
- Cluster unhealthy after automated upgrade from 2021.10
- Upgrade fails due to unhealthy Ceph
- RKE2 not getting started due to space issue
- Volume unable to mount and remains in attach/detach loop state
- Upgrade fails due to classic objects in the Orchestrator database
- Ceph cluster found in a degraded state after side-by-side upgrade
- Unhealthy Insights component causes the migration to fail
- Service upgrade fails for Apps
- In-place upgrade timeouts
- Docker registry migration stuck in PVC deletion stage
- AI Center provisioning failure after upgrading to 2023.10 or later
- Upgrade fails in offline environments
- SQL validation fails during upgrade
- snapshot-controller-crds pod in CrashLoopBackOff state after upgrade
- Longhorn REST API endpoint upgrade/reinstall error
- Upgrade fails due to overridden Insights PVC sizes
- Service upgrade fails during pre-service script execution
- Setting a timeout interval for the management portals
- Authentication not working after migration
- Kinit: Cannot find KDC for realm <AD Domain> while getting initial credentials
- Kinit: Keytab contains no suitable keys for *** while getting initial credentials
- GSSAPI operation failed due to invalid status code
- Alarm received for failed Kerberos-tgt-update job
- SSPI provider: Server not found in Kerberos database
- Login failed for AD user due to disabled account
- ArgoCD login failed
- Update the underlying directory connections
- Failure to get the sandbox image
- Pods not showing in ArgoCD UI
- Redis probe failure
- RKE2 server fails to start
- Secret not found in UiPath namespace
- ArgoCD goes into progressing state after first installation
- Unhealthy services after cluster restore or rollback
- Pods stuck in Init:0/X
- Missing Ceph-rook metrics from monitoring dashboards
- Pods cannot communicate with FQDN in a proxy environment
- Failure to configure email alerts post upgrade
- No healthy upstream issue
- Failure to add agent nodes in offline environments
- Accessing FQDN returns RBAC: access denied error
- Document Understanding not on the left rail of Automation Suite
- Failed status when creating a data labeling session
- Failed status when trying to deploy an ML skill
- Migration job fails in ArgoCD
- Handwriting recognition with intelligent form extractor not working
- Failed ML skill deployment due to token expiry
- Running High Availability with Process Mining
- Process Mining ingestion failed when logged in using Kerberos
- After Disaster Recovery Dapr is not working properly for Process Mining
- Configuring Dapr with Redis in cluster mode
- Unable to connect to AutomationSuite_ProcessMining_Warehouse database using a pyodbc format connection string
- Airflow installation fails with sqlalchemy.exc.ArgumentError: Could not parse rfc1738 URL from string ''
- How to add an IP table rule to use SQL Server port 1433
- Automation Suite certificate is not trusted from the server where CData Sync is running
- Running the diagnostics tool
- Using the Automation Suite support bundle
- Exploring Logs
- Exploring summarized telemetry

Automation Suite on Linux installation guide
How to forward application logs to Splunk
- This section applies only to Automation Suite versions 2023.10.6 and earlier. For newer Automation Suite versions, refer to Forwarding application logs to external tools.
- This section covers exporting POD logs. For exporting robot logs, see Orchestrator - About Logs.
- Splunk is an external tool, and UiPath® does not have an opinion on how you should configure your Splunk setting. For more details about HTTP Event Collector, see Splunk official documentation.
The Splunk-Fluentd stack is a centralized logging solution that allows you to search, analyze, and visualize log data. Fluentd collects and sends the logs to Splunk. Splunk retrieves the logs and lets you visualize and analyze the data.
To configure Splunk, take the following steps:
-
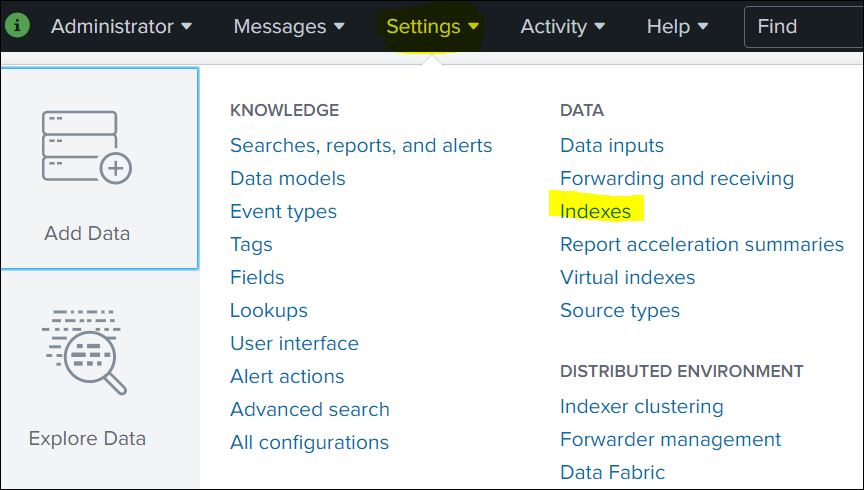
Click Settings in the top navigation bar, and then select Indexes.
-
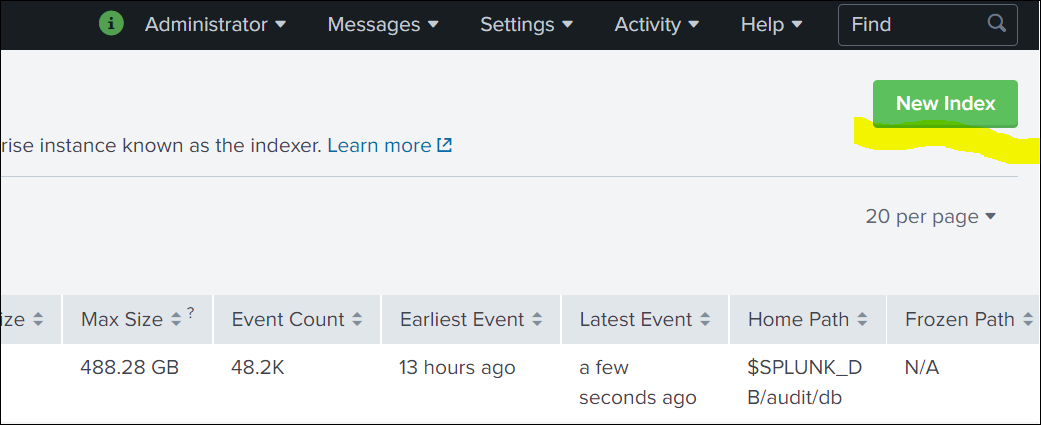
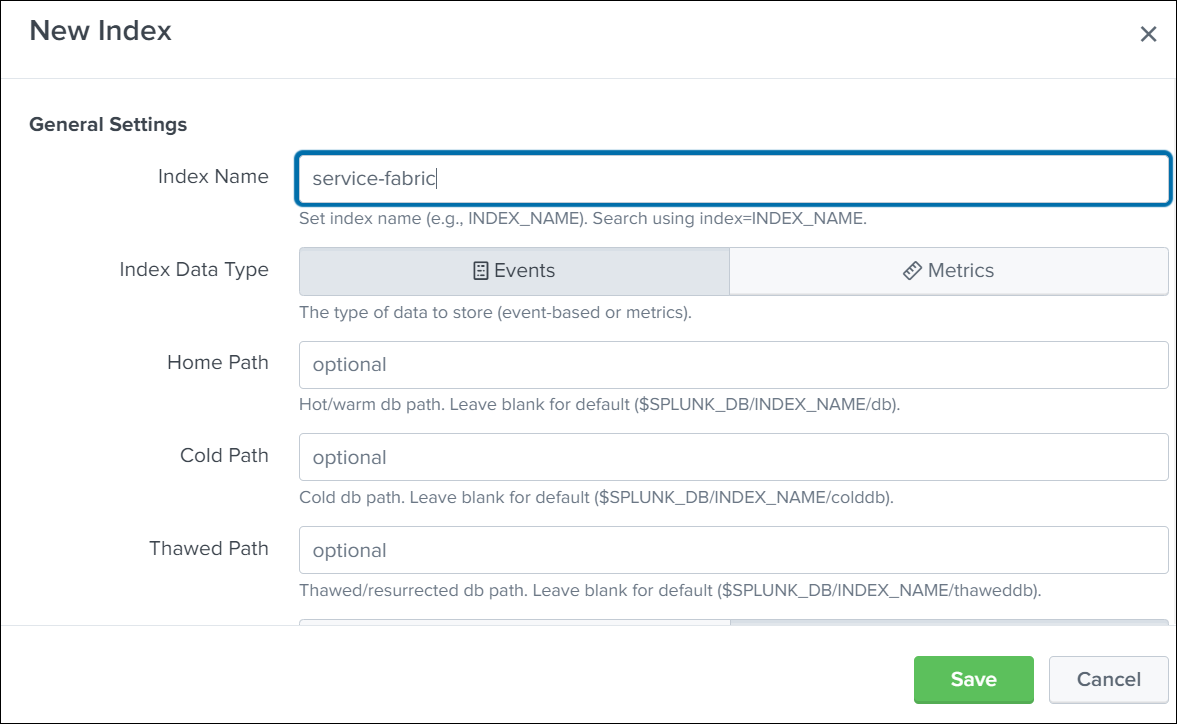
Click New Index and then Create an index.
-
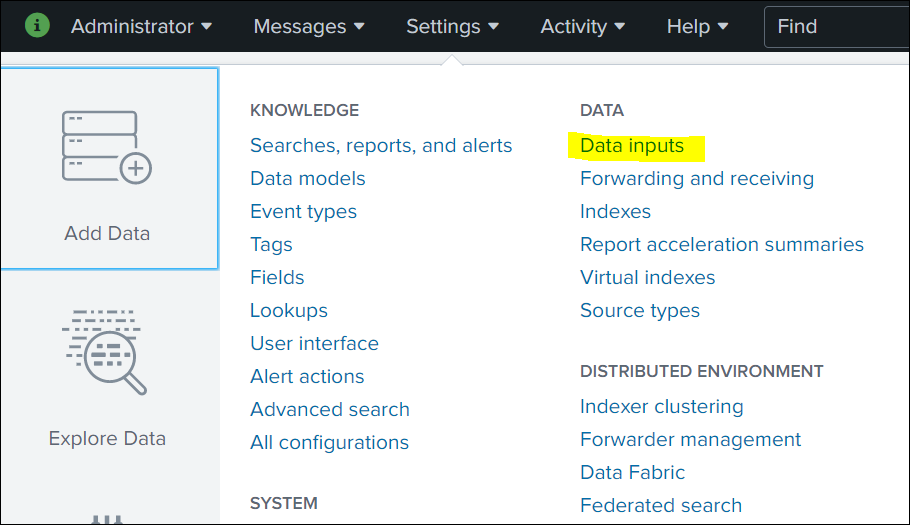
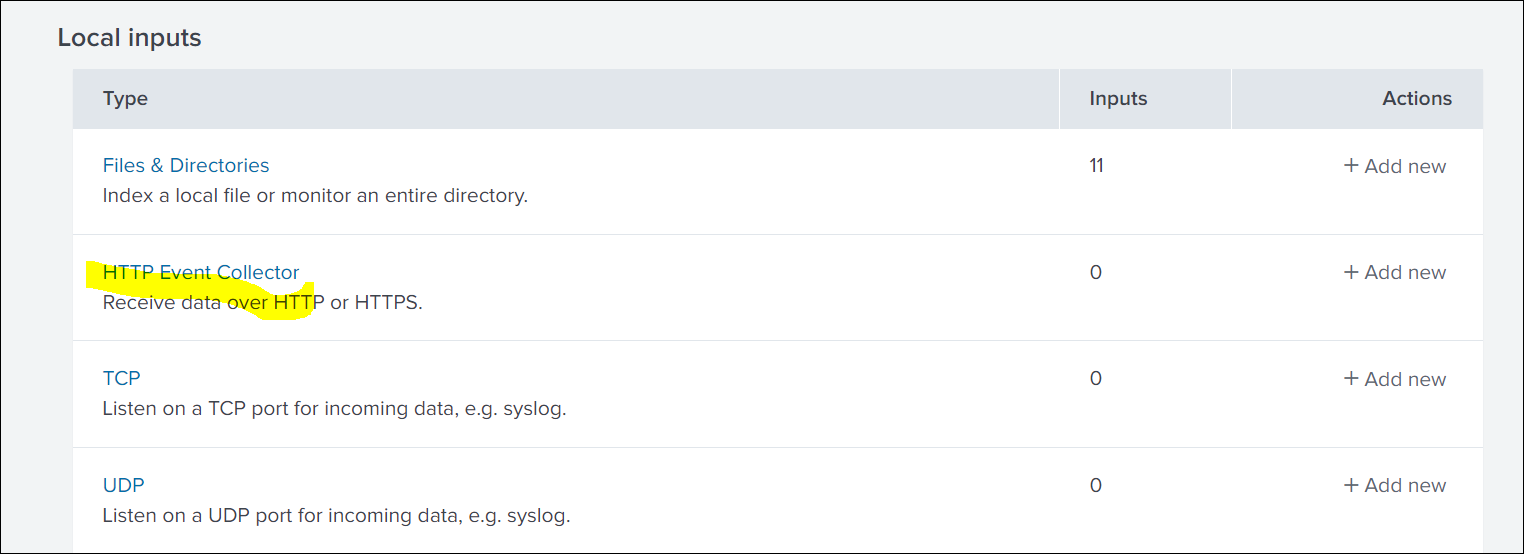
Click Settings in the top navigation bar, and then select Data inputs.
-
Click HTTP Event Collector.
-
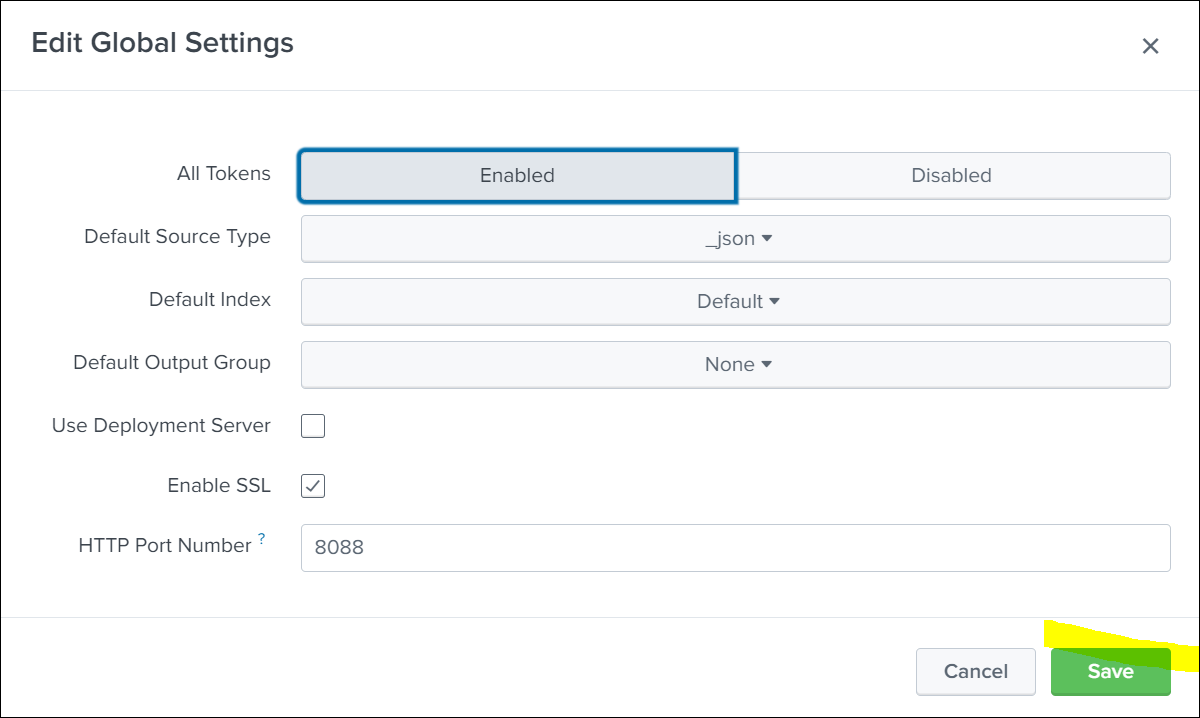
To enable the new token creation, click Global Settings .

-
Enable and save the Global Settings.
-
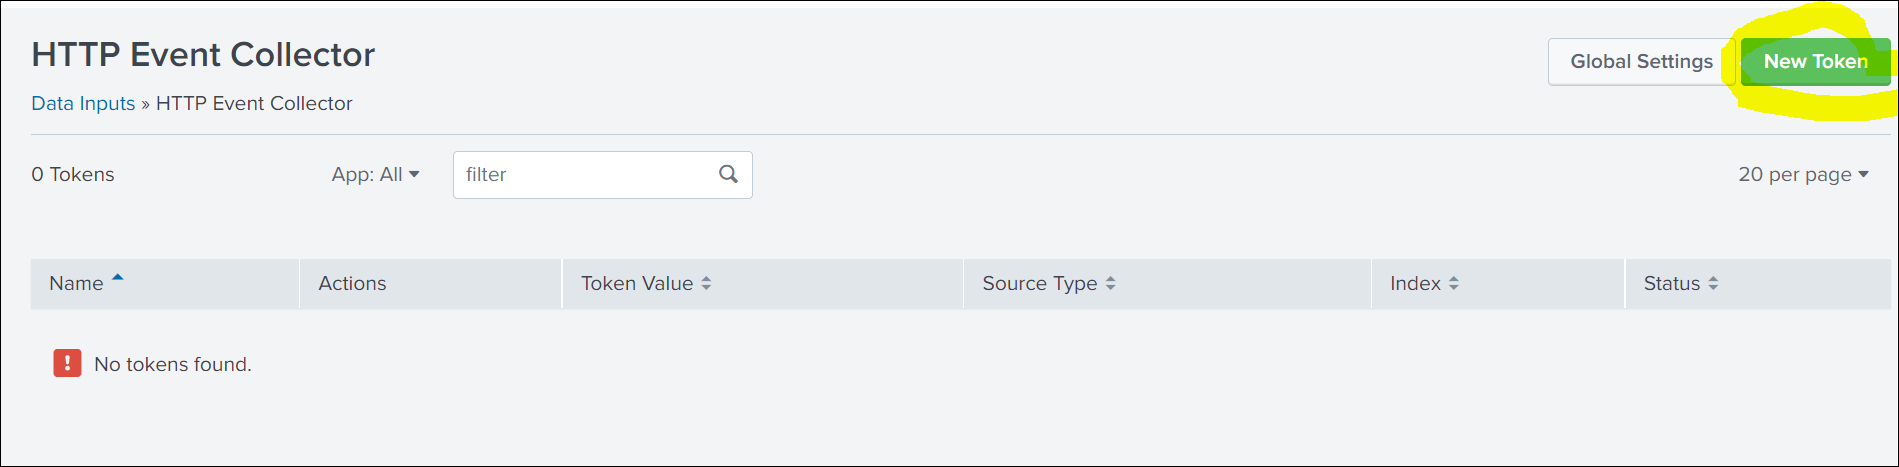
To create the token, click New Token.
-
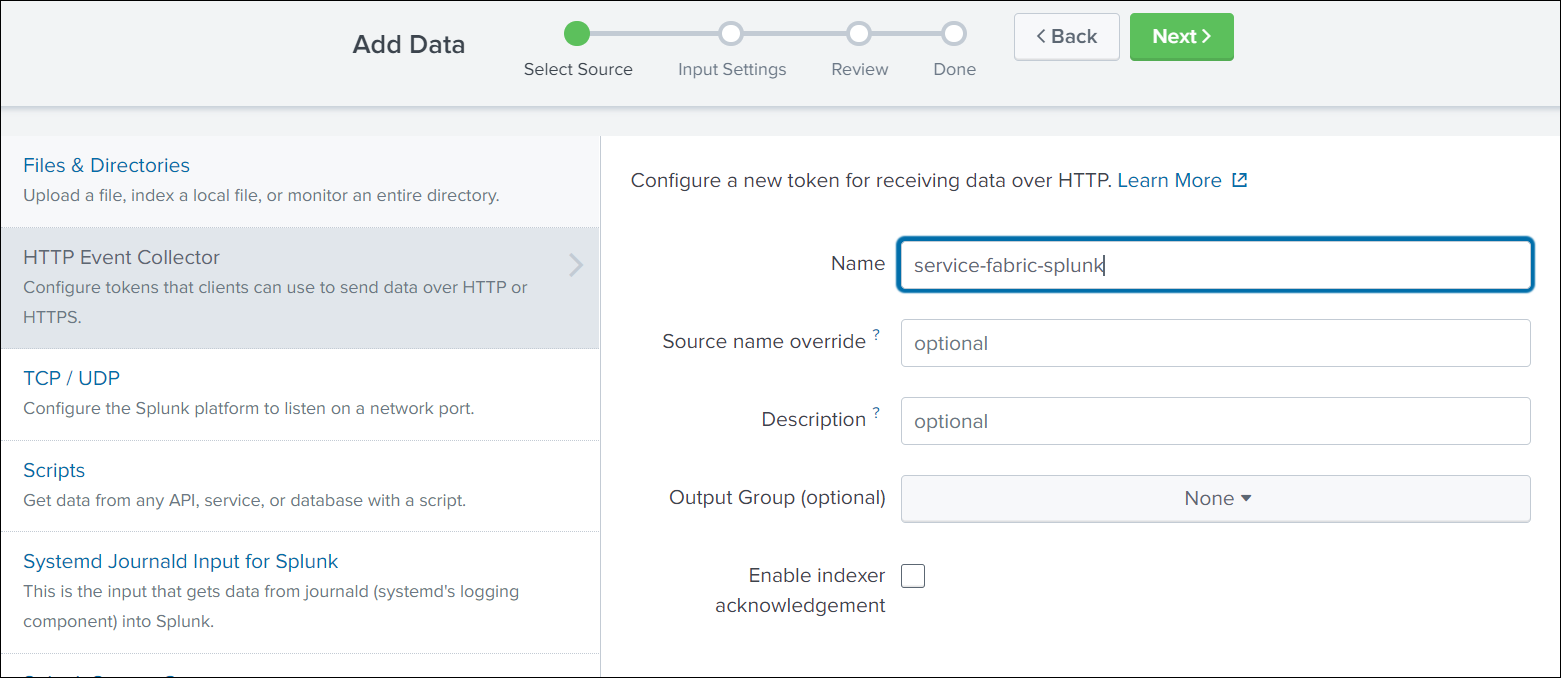
Enter a name for the HTTP Event Collector and click Next.
-
Click New and enter Source Type details.
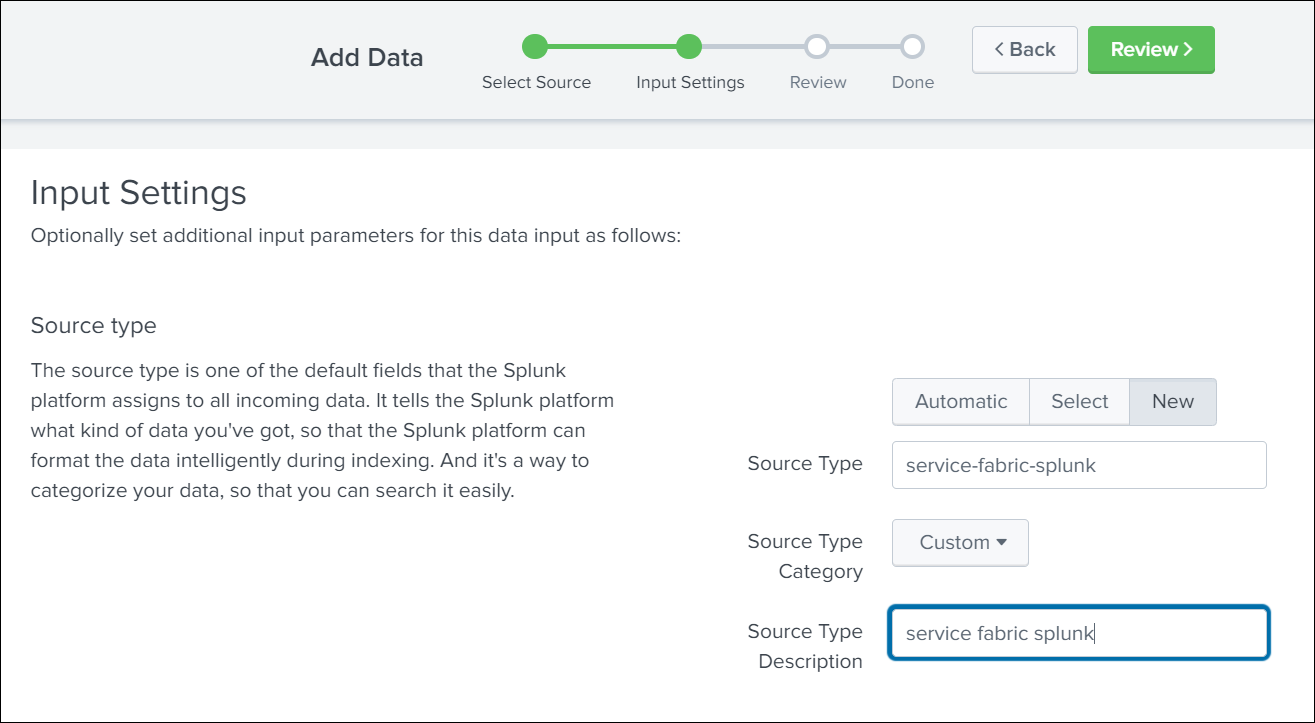
-
Scroll down and select Index from the available list of indexes, and click Next in the top navigation bar.
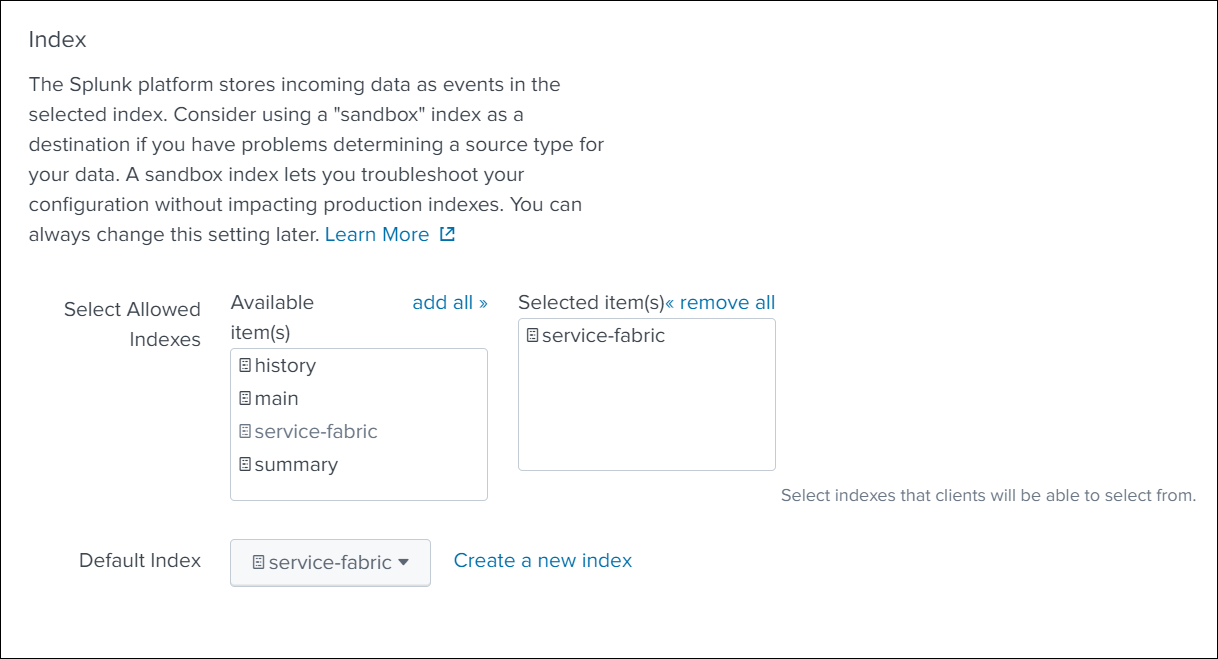
-
Verify the data and click Submit.
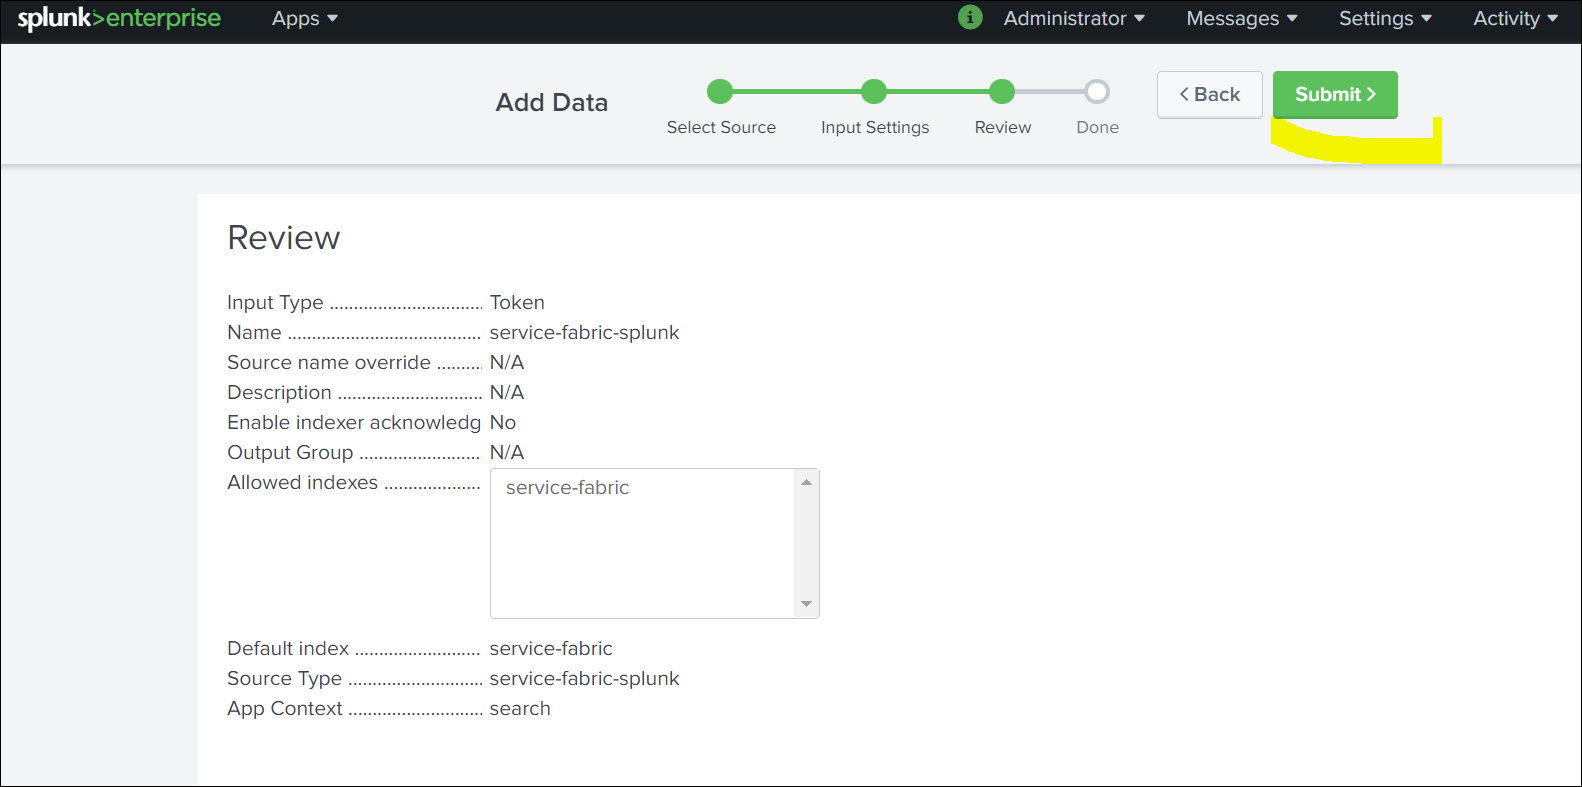
-
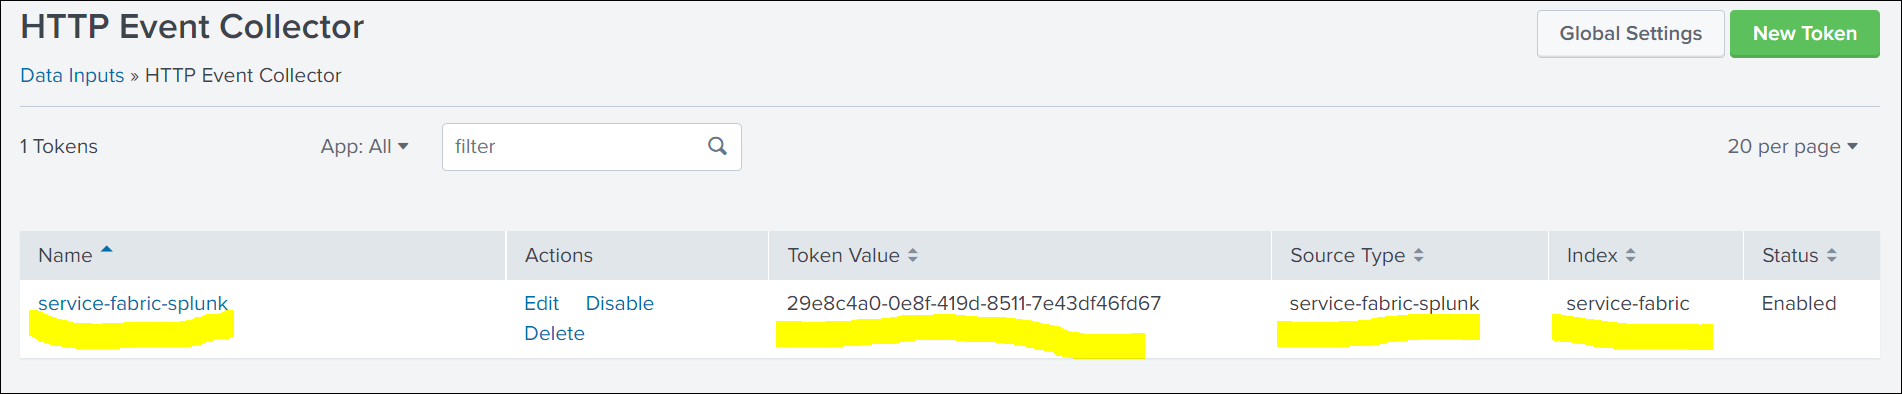
Once created, fetch the details of Token ID,Index,Source,Source Type. You need these values to set up ClusterOutput.
Creating a secret with a token
Create a Kubernetes secret with the HTTP Event Collector (HEC) token generated in the Splunk UI. This token is used for the authentication between Automation Suite and Splunk.
kubectl -n cattle-logging-system create secret generic splunk-hec-token --from-literal=splunk_hec_token=<splunk_hec_token>
kubectl -n cattle-logging-system create secret generic splunk-hec-token --from-literal=splunk_hec_token=<splunk_hec_token>
ClusterOutput to Splunk
A ClusterOutput defines where your logs are sent to and describes the configuration and authentication details.
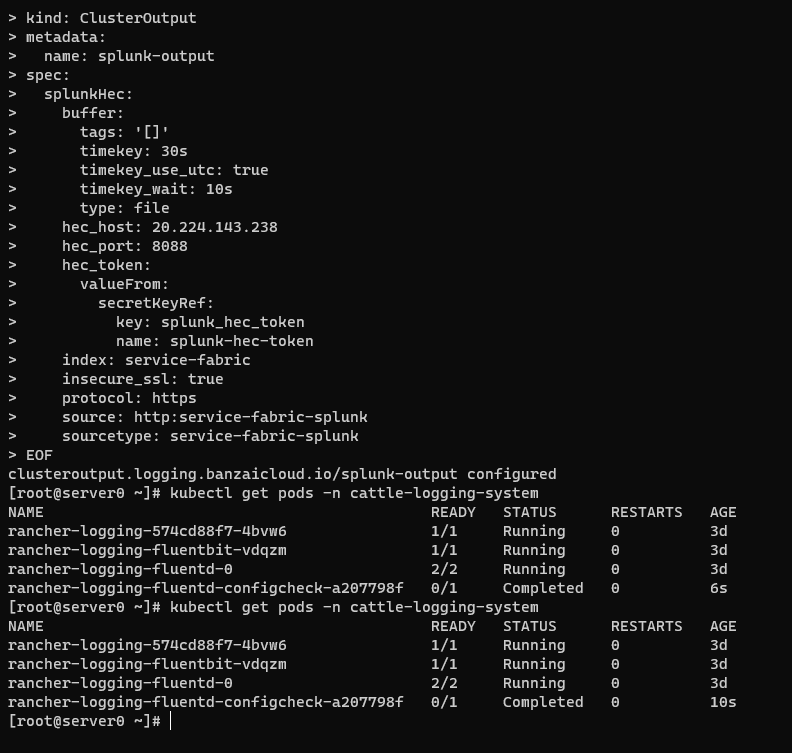
To configure the ClusterOutput for Splunk, run the following command:
kubectl -n cattle-logging-system apply -f - <<"EOF"
apiVersion: logging.banzaicloud.io/v1beta1
kind: ClusterOutput
metadata:
  name: splunk-output
spec:
  splunkHec:
    buffer:
      tags: '[]'
      timekey: <splunk_hec_timekey>
      timekey_use_utc: true
      timekey_wait: 10s
      type: file
    hec_host: <splunk_hec_host>
    hec_port: <splunk_hec_port>
    hec_token:
      valueFrom:
        secretKeyRef:
          key: splunk_hec_token
          name: splunk-hec-token
    index: <splunk_hec_index>
    insecure_ssl: true
    protocol: <splunk_hec_protocol>
    source: <splunk_hec_source>
    sourcetype: <splunk_hec_source_type>
EOF
Replace the attributes between angle brackets < > with the corresponding values used in your Splunk configuration. For details, see the following table:
| Attribute | Description |
|---|---|
splunk_hec_host | The network host of your Splunk instance. This is usually the IP address or FQDN of Splunk. |
splunk_hec_port | The Splunk port for client communication. This port usually differs from the port on which you launch the Splunk dashboard. The conventional HEC port for Splunk is 8088. |
secret_key | The secret key of the Splunk token. This is the name of the key in the secret you created in the previous step, which holds Splunk HEC token. The presented manifest already contains the key: splunk_hec_token. If you have not altered the command to create a secret, you do not need to change this value. |
splunk_hec_timekey value in splunkHec.buffer | The output frequency, or how often you want to push logs. We recommend using a 30-seconds (30s) interval. |
protocol | The URL protocol. Valid values are http and https. You must use HTTPS protocol if you have SSL communication enabled on Splunk. |
splunk_hec_index | The identifier for the Splunk index. Used to index events. |
splunk_hec_source | The source field for events. |
splunk_hec_source_type | The source type field for events. |
The following example is based on the configuration presented on this page.
ClusterFlow in Fluentd
Use the ClusterFlow to define:
- the logs you want to collect and filter;
- the
ClusterOutputto send the logs to.
To configure ClusterFlow in Fluentd, run the following command:
kubectl -n cattle-logging-system apply -f - <<"EOF"
apiVersion: logging.banzaicloud.io/v1beta1
kind: ClusterFlow
metadata:
  name: splunk-flow
  namespace: cattle-logging-system
spec:
  filters:
  - tag_normaliser:
      format: ${namespace_name}/${pod_name}.${container_name}
  globalOutputRefs:
  - splunk-output
  match:
  - select:
      container_names:
      - istio-proxy
      namespaces:
      - istio-system
  - exclude:
      container_names:
      - istio-proxy
      - istio-init
      - aicenter-hit-count-update
      - istio-configure-executor
      - on-prem-tenant-license-update
      - curl
      - recovery
      - aicenter-oob-scheduler
      - cert-trustor
  - exclude:
      namespaces:
      - fleet-system
      - cattle-gatekeeper-system
      - default
  - exclude:
      labels:
        app: csi-snapshotter
  - exclude:
      labels:
        app: csi-resizer
  - select: {}
EOF
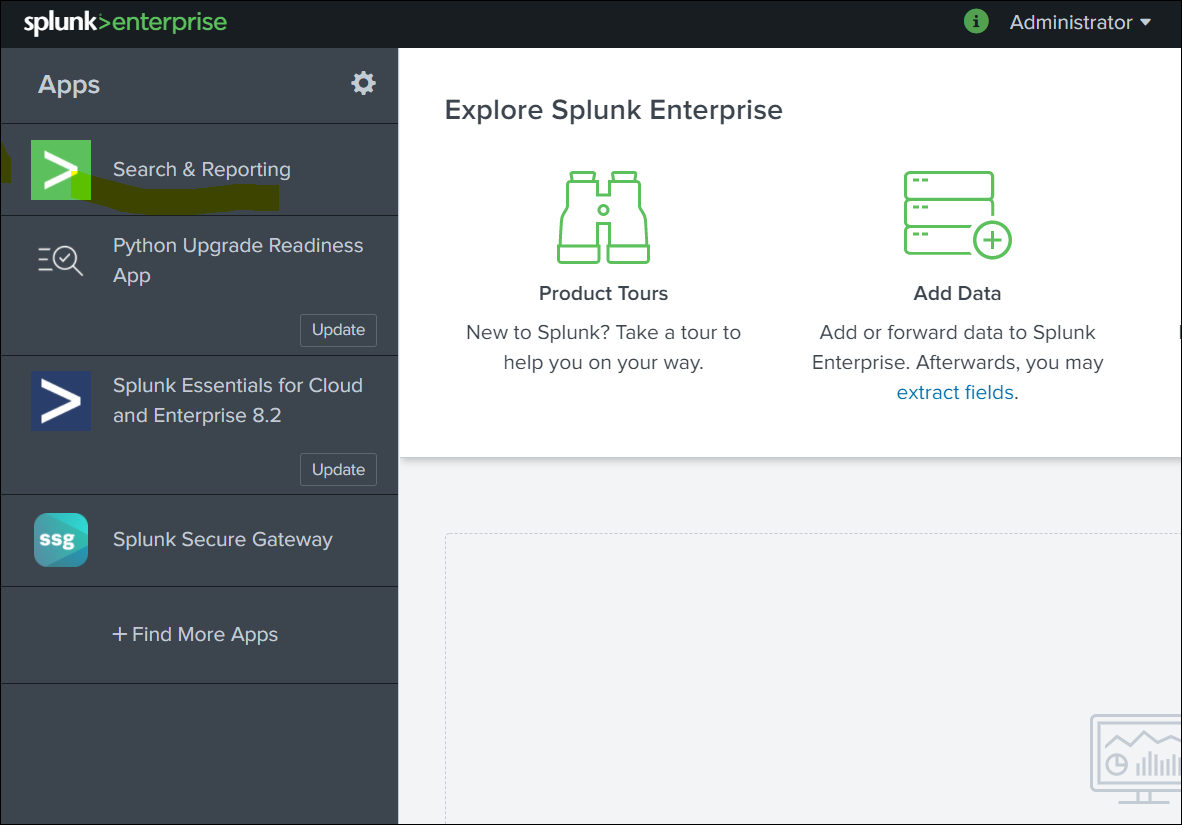
Searching in Splunk
-
Select Search & Reporting.
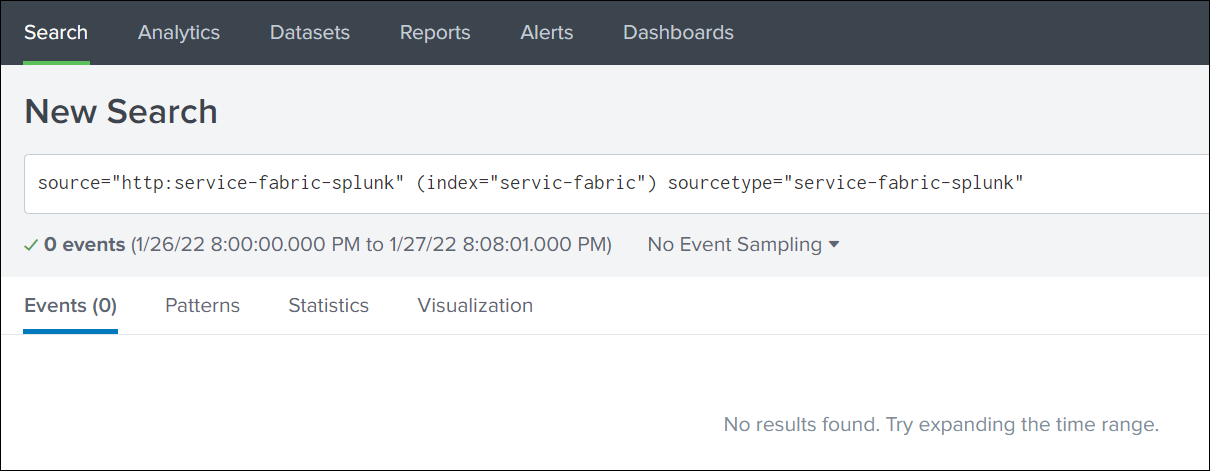
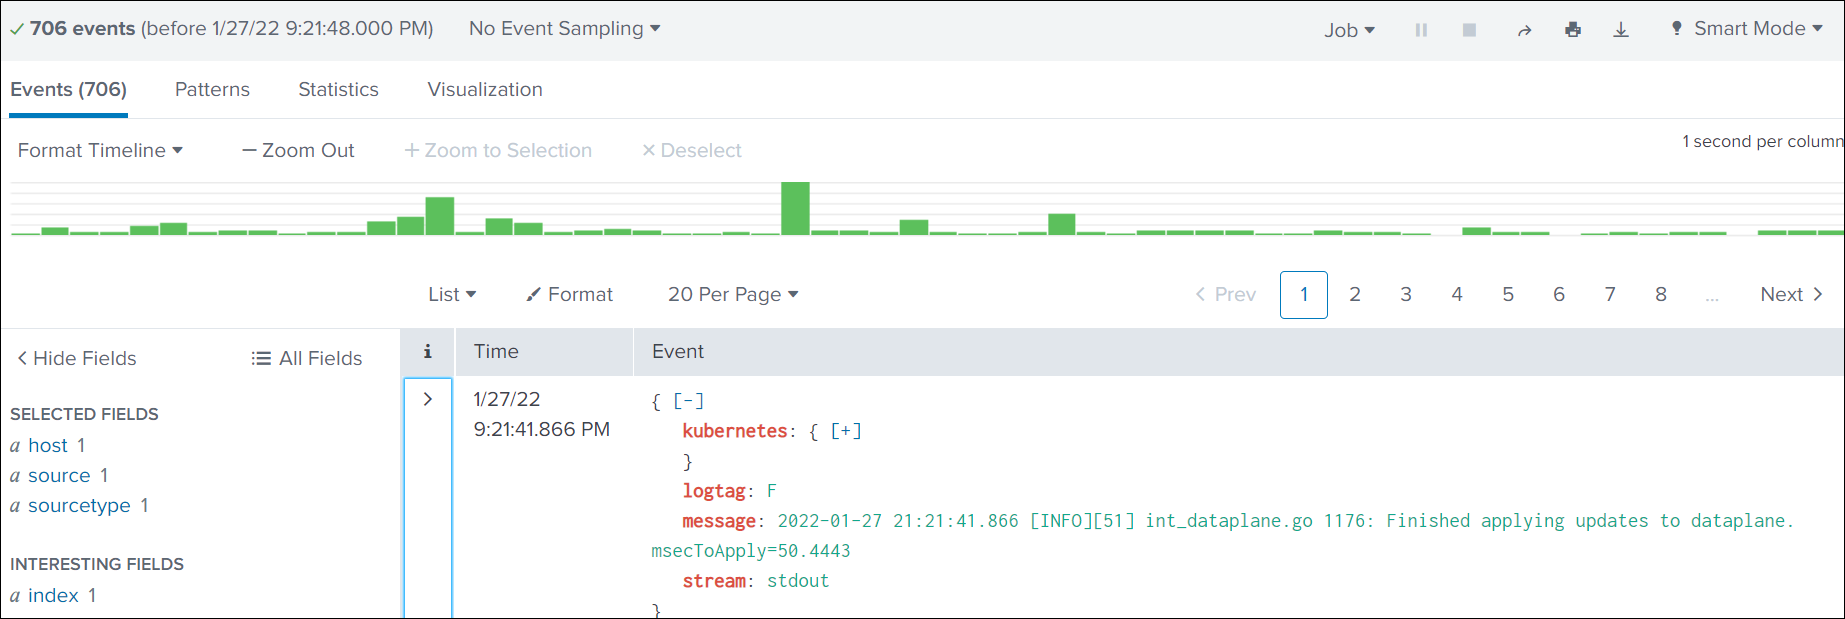
-
Search based on Source, Index, and SourceType.
Troubleshooting
If, for some reason, the application logs are not pushed to Splunk, take the following steps:
- Change the Fluentd log level to debug.
- Query the Fluentd pod:
kubectl patch loggings.logging.banzaicloud.io rancher-logging-root --type=json -p '[{"op":"add","path":"/spec/fluentd/logLevel","value":debug}]' kubectl -n cattle-logging-system exec -it sts/rancher-logging-root-fluentd cat /fluentd/log/outkubectl patch loggings.logging.banzaicloud.io rancher-logging-root --type=json -p '[{"op":"add","path":"/spec/fluentd/logLevel","value":debug}]' kubectl -n cattle-logging-system exec -it sts/rancher-logging-root-fluentd cat /fluentd/log/outNote:The Fluentd logs should indicate the cause of data not being pushed to Splunk.
- After fixing the issue, restore the Fluentd log level:
kubectl patch loggings.logging.banzaicloud.io rancher-logging-root --type=json -p '[{"op":"remove","path":"/spec/fluentd/logLevel"}]'kubectl patch loggings.logging.banzaicloud.io rancher-logging-root --type=json -p '[{"op":"remove","path":"/spec/fluentd/logLevel"}]'