- Overview
- UI Automation
- About the UI Automation activity package
- Applications and technologies automated with UI Automation
- Project compatibility
- UI-ANA-016 - Pull Open Browser URL
- UI-ANA-017 - ContinueOnError True
- UI-ANA-018 - List OCR/Image Activities
- UI-DBP-006 - Container Usage
- UI-DBP-013 - Excel Automation Misuse
- UI-DBP-030 - Forbidden Variables Usage In Selectors
- UI-DBP-031 - Activity verification
- UI-PRR-001 - Simulate Click
- UI-PRR-002 - Simulate Type
- UI-PRR-003 - Open Application Misuse
- UI-PRR-004 - Hardcoded Delays
- UI-REL-001 - Large Idx in Selectors
- UI-SEC-004 - Selector Email Data
- UI-SEC-010 - App/Url Restrictions
- UI-USG-011 - Non Allowed Attributes
- UX-SEC-010 - App/Url Restrictions
- UX-DBP-029 - Insecure Password Use
- UI-PST-001 - Audit Log Level in Project Settings
- UiPath Browser Migration Tool
- Clipping region
- Computer Vision Recorder
- Activities index
- Activate
- Anchor Base
- Attach Browser
- Attach Window
- Block User Input
- Callout
- Check
- Click
- Click Image
- Click Image Trigger
- Click OCR Text
- Click Text
- Click Trigger
- Close Application
- Close Tab
- Close Window
- Context Aware Anchor
- Copy Selected Text
- Element Attribute Change Trigger
- Element Exists
- Element Scope
- Element State Change Trigger
- Export UI Tree
- Extract Structured Data
- Find Children
- Find Element
- Find Image
- Find Image Matches
- Find OCR Text Position
- Find Relative Element
- Find Text Position
- Get Active Window
- Get Ancestor
- Get Attribute
- Get Event Info
- Get From Clipboard
- Get Full Text
- Get OCR Text
- Get Password
- Get Position
- Get Source Element
- Get Text
- Get Visible Text
- Go Back
- Go Forward
- Go Home
- Google Cloud Vision OCR
- Hide Window
- Highlight
- Hotkey Trigger
- Hover
- Hover Image
- Hover OCR Text
- Hover Text
- Image Exists
- Indicate On Screen
- Inject .NET Code
- Inject Js Script
- Invoke ActiveX Method
- Key Press Trigger
- Load Image
- Maximize Window
- Microsoft Azure Computer Vision OCR
- Microsoft OCR
- Microsoft Project Oxford Online OCR
- Minimize Window
- Monitor Events
- Mouse Trigger
- Move Window
- Navigate To
- OCR Text Exists
- On Element Appear
- On Element Vanish
- On Image Appear
- On Image Vanish
- Open Application
- Open Browser
- Refresh Browser
- Replay User Event
- Restore Window
- Save Image
- Select Item
- Select Multiple Items
- Send Hotkey
- Set Clipping Region
- Set Focus
- Set Text
- Set To Clipboard
- Set Web Attribute
- Show Window
- Start Process
- System Trigger
- Take Screenshot
- Tesseract OCR
- Text Exists
- Tooltip
- Type Into
- Type Secure Text
- Use Foreground
- Wait Attribute
- Wait Element Vanish
- Wait Image Vanish
- Accessibility Check
- Application Event Trigger
- Block User Input
- Check/Uncheck
- Check App State
- Check Element
- Click
- Click Event Trigger
- Drag and Drop
- Extract Table Data
- Find Elements
- For Each UI Element
- Get Browser Data
- Get Clipboard
- Get Text
- Get URL
- Go to URL
- Highlight
- Hover
- Inject Js Script
- Keyboard Shortcuts
- Keypress Event Trigger
- Mouse Scroll
- Navigate Browser
- Select Item
- Set Browser Data
- Set Clipboard
- Set Runtime Browser
- Set Focus
- Set Text
- Take Screenshot
- Type Into
- Unblock User Input
- Use Application/Browser
- Window Operation
- Perform browser search and retrieve results using UI Automation APIs
- Web Browsing
- Find Images
- Click Images
- Trigger and Monitor Events
- Create and Override Files
- HTML Pages: Extract and Manipulate Information
- Window Manipulation
- Automated List Selection
- Find and Manipulate Window Elements
- Manage Text Automation
- Load and Process Images
- Manage Mouse Activated Actions
- Automate Application Runtime
- Automated Run of a Local Application
- Browser Navigation
- Web Automation
- Trigger Scope Example
- Enable UI Automation support in DevExpress
- Computer Vision Local Server
- Mobile Automation
- Release notes
- About the mobile device automation architecture
- Project compatibility
- Get Log Types
- Get Logs
- Get Page Source
- Get Device Orientation
- Get Session Identifier
- Install App
- Manage Current App
- Manage Other App
- Open DeepLink
- Open URL
- Mobile Device Connection
- Directional Swipe
- Draw Pattern
- Positional Swipe
- Press Hardware Button
- Set Device Orientation
- Take Screenshot
- Take Screenshot Part
- Element Exists
- Execute Command
- Get Attribute
- Get Selected Item
- Get Text
- Set Selected Item
- Set Text
- Swipe
- Tap
- Type Text
- Terminal
- Release notes
- About the Terminal activity package
- Project compatibility
- Best practices
- Find Text
- Get Color at Position
- Get Cursor Position
- Get Field
- Get Field at Position
- Get Screen Area
- Get Text
- Get Text at Position
- Move Cursor
- Move Cursor to Text
- Send Control Key
- Send Keys
- Send Keys Secure
- Set Field
- Set Field at Position
- Terminal Session
- Wait Field Text
- Wait Screen Ready
- Wait Screen Text
- Wait Text at Position

UI Automation activities
Debugging
Examine Appium logs and inspect elements on your device to better understand what has happened during automation.
Debug tool
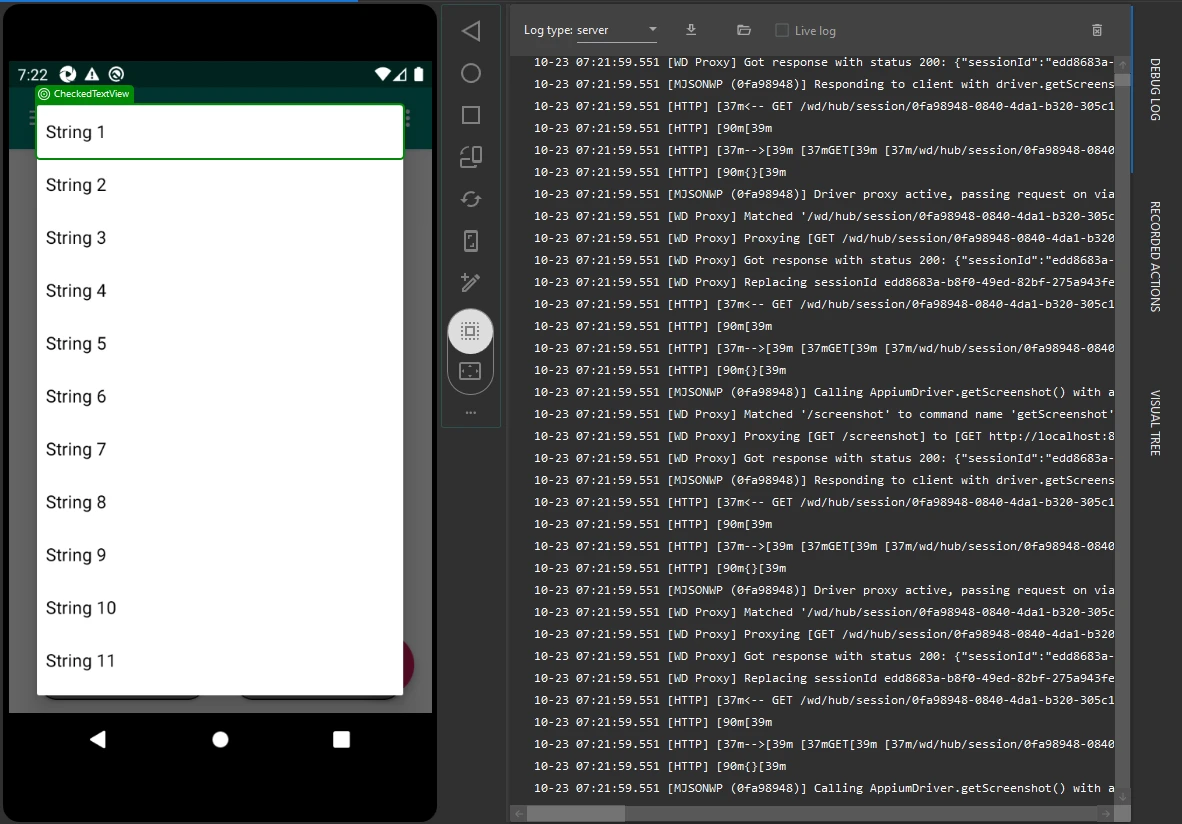
Use the debug tool to dig into the details of your automation, examining the Appium log output. For example, you might be needing to have a look at low-level server logs to understand what has happened during the executed operations. You can then hover your mouse over an event to see full details (e.g. determine when the connection was created, or when the test had started).
To open the debug panel:
-
Click the Debug Tool button to expand the panel details.
-
Click Log Type and select an option from the dropdown.
-
Click Get Logs.
-
(Optional) Click Live Log to retrieve events in real-time.

Logs Path
To configure a location for your logs, open MDM and navigate to Project Setting > Project Level Settings > Logs Path. Consider setting the log path to a shared network drive to expand member access to resources.
Log Types
You can get one of the following log types, depending on your requirements.
| iOS | Android |
|---|---|
| syslog: Device logs. | server: Appium server logs. |
| crashlog: Crash logs. | logcat: Device logs. |
| performance: Information about the iOS performance on the device. | |
| server: Appium server logs. | |
| safariConsole: Safari console logs. | |
| safariNetwork: Network requests. |
Working With Debugging Logs
The following table lists the actions that you can take to manage your debugging logs.
| Action | Description | Procedure |
|---|---|---|
| Get Logs | Retrieve logs. |
|
| Open File Location | Open the location where log is stored. | Follow the Get Logs procedure and click Open File Location . |
| Live Log | Retrieve events to your log in real-time. | Android: log cat |
| Clear | Clear the current view. | Follow the Get Logs procedure and click Clear to remove the log. Alternatively, you can get a different log to clear the panel and move to the next debugging step. |
Visual tree tool
Use the visual tree tool to view how the page looks like or to see elements that can potentially be automated.
To open the visual tree panel:
- Start an application in Mobile Device Manager.
- Click the Visual Tree button to expand the panel details.
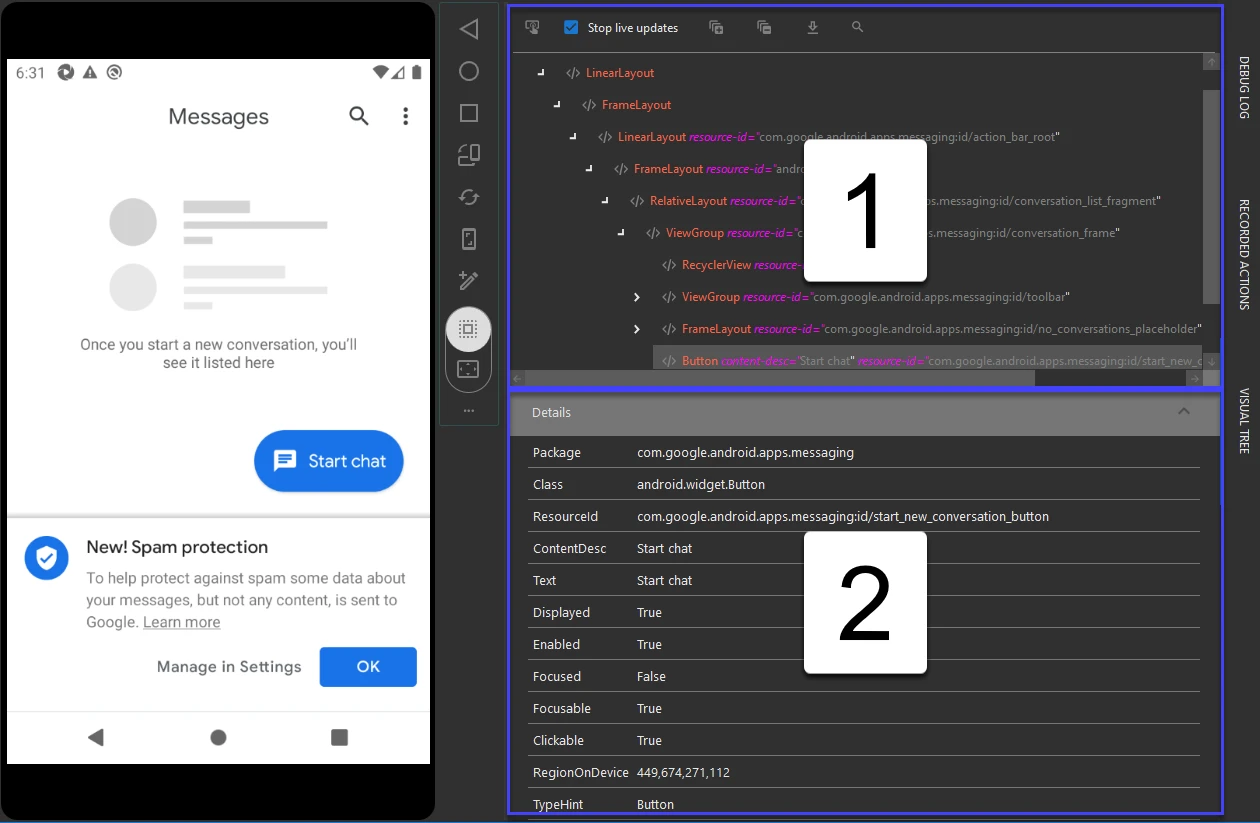
- Click Inspect Element and then click any element on your device. The element information is divided into two parts:
-
In the 1st border frame, you can look for the tree structure of your elements. Hover the mouse over an entry to highlight its corresponding element on the device.
-
In the 2nd border frame, you can view element details. The information from this panel changes whenever you use the search function.

Working With Visual Tree
The following table lists the actions that you can take to view the inspected elements.
| Action | Description | Procedure |
|---|---|---|
| Inspect Element | Inspect elements on the device. |
|
| Stop Live Updates | Stop receiving element info. This option is activated as soon as you click an entry in the tree structure panel. | To uncheck this option you must first use the Inspect Element tool.
|
| Expand All | Expand all elements. |
|
| Collapse All | Collapse all elements. |
|
| Export Page Source | Export the page source as an XML file. |
|
| Search | Search for element details. |
|
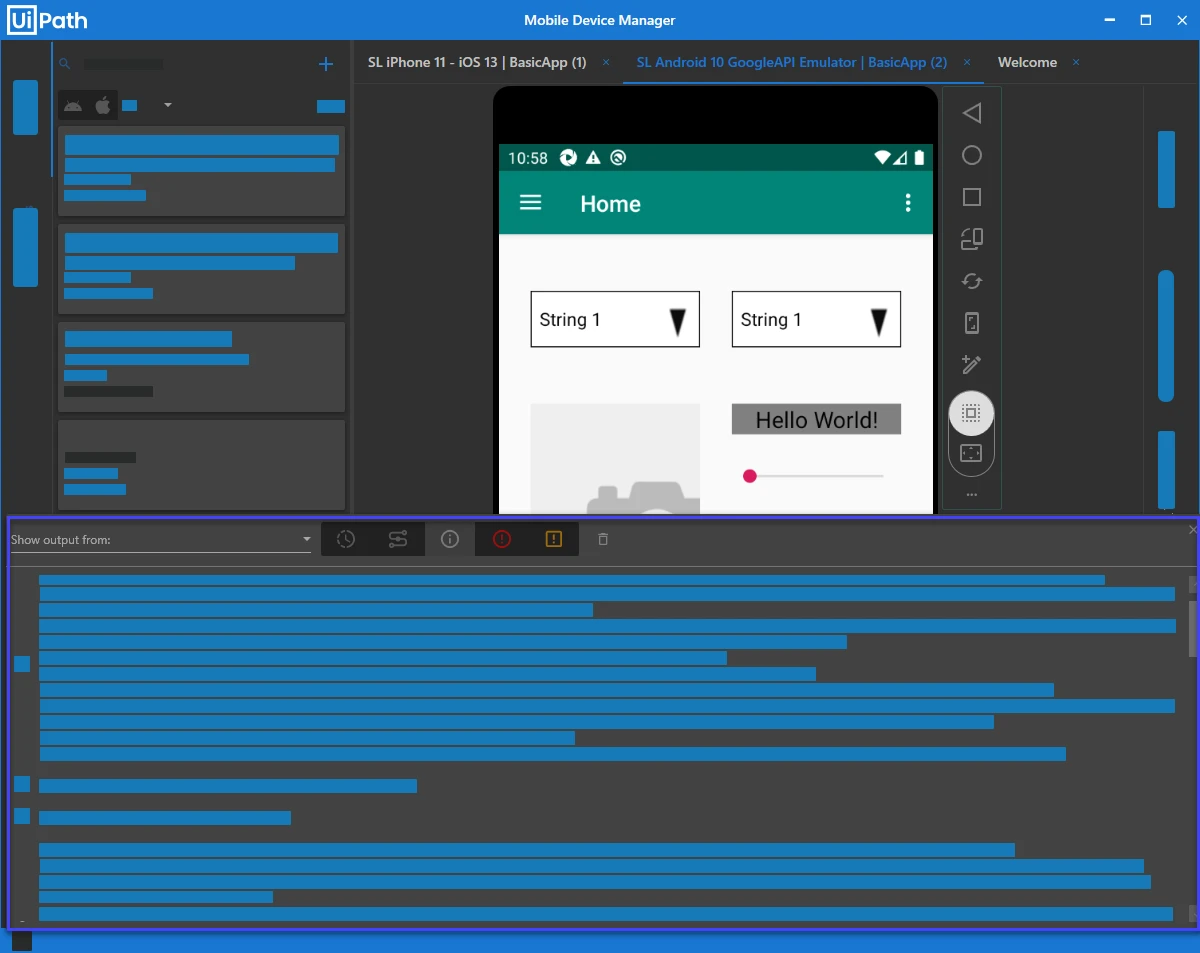
Working With Status
You can open the status panel to glance over events such as connection info, error messages, and statuses. To open the status panel, click the hamburger button at the bottom-right of Mobile Device Manager.
