- Getting Started
- Setup and Configuration
- Automation Projects
- Dependencies
- Types of Workflows
- File Comparison
- Automation Best Practices
- Source Control Integration
- Debugging
- The Diagnostic Tool
- Workflow Analyzer
- About Workflow Analyzer
- ST-NMG-001 - Variables Naming Convention
- ST-NMG-002 - Arguments Naming Convention
- ST-NMG-004 - Display Name Duplication
- ST-NMG-005 - Variable Overrides Variable
- ST-NMG-006 - Variable Overrides Argument
- ST-NMG-008 - Variable Length Exceeded
- ST-NMG-009 - Prefix Datatable Variables
- ST-NMG-011 - Prefix Datatable Arguments
- ST-NMG-012 - Argument Default Values
- ST-NMG-016 - Argument Length Exceeded
- ST-DBP-002 - High Arguments Count
- ST-DBP-003 - Empty Catch Block
- ST-DBP-007 - Multiple Flowchart Layers
- ST-DBP-020 - Undefined Output Properties
- ST-DBP-021 - Hardcoded Timeout
- ST-DBP-023 - Empty Workflow
- ST-DBP-024 - Persistence Activity Check
- ST-DBP-025 - Variables Serialization Prerequisite
- ST-DBP-026 - Delay Activity Usage
- ST-DBP-027 - Persistence Best Practice
- ST-DBP-028 - Arguments Serialization Prerequisite
- ST-USG-005 - Hardcoded Activity Arguments
- ST-USG-009 - Unused Variables
- ST-USG-010 - Unused Dependencies
- ST-USG-014 - Package Restrictions
- ST-USG-020 - Minimum Log Messages
- ST-USG-024 - Unused Saved for Later
- ST-USG-025 - Saved Value Misuse
- ST-USG-026 - Activity Restrictions
- ST-USG-027 - Required Packages
- ST-USG-028 - Restrict Invoke File Templates
- ST-USG-032 - Required Tags
- ST-USG-034 - Automation Hub URL
- Variables
- Arguments
- Imported Namespaces
- Coded automations
- Trigger-based Attended Automation
- Control Flow
- Object Repository
- Logging
- The ScreenScrapeJavaSupport Tool
- Studio testing
- Extensions
- About extensions
- SetupExtensions tool
- UiPathRemoteRuntime.exe is not running in the remote session
- UiPath Remote Runtime blocks Citrix session from being closed
- UiPath Remote Runtime causes memory leak
- UiPath.UIAutomation.Activities package and UiPath Remote Runtime versions mismatch
- The required UiPath extension is not installed on the remote machine
- Screen resolution settings
- Group Policies
- Cannot communicate with the browser
- Chrome extension is removed automatically
- The extension may have been corrupted
- Check if the extension for Chrome is installed and enabled
- Check if ChromeNativeMessaging.exe is running
- Check if ComSpec variable is defined correctly
- Enable access to file URLs and Incognito mode
- Multiple browser profiles
- Group Policy conflict
- Known issues specific to MV3 extensions
- List of extensions for Chrome
- Chrome Extension on Mac
- Group Policies
- Cannot communicate with the browser
- Edge extension is removed automatically
- The extension may have been corrupted
- Check if the Extension for Microsoft Edge is installed and enabled
- Check if ChromeNativeMessaging.exe is running
- Check if ComSpec variable is defined correctly
- Enable access to file URLs and InPrivate mode
- Multiple browser profiles
- Group Policy conflict
- Known issues specific to MV3 extensions
- List of extensions for Edge
- Extension for VMware Horizon
- SAP Solution Manager plugin
- Excel Add-in
- Troubleshooting

Studio user guide
Test Explorer
Overview
Test Explorer is a panel that shows information relevant to test automation. You can use Test Explorer and its sub-panels to group tests together, perform debugging, or analyze activity coverage.
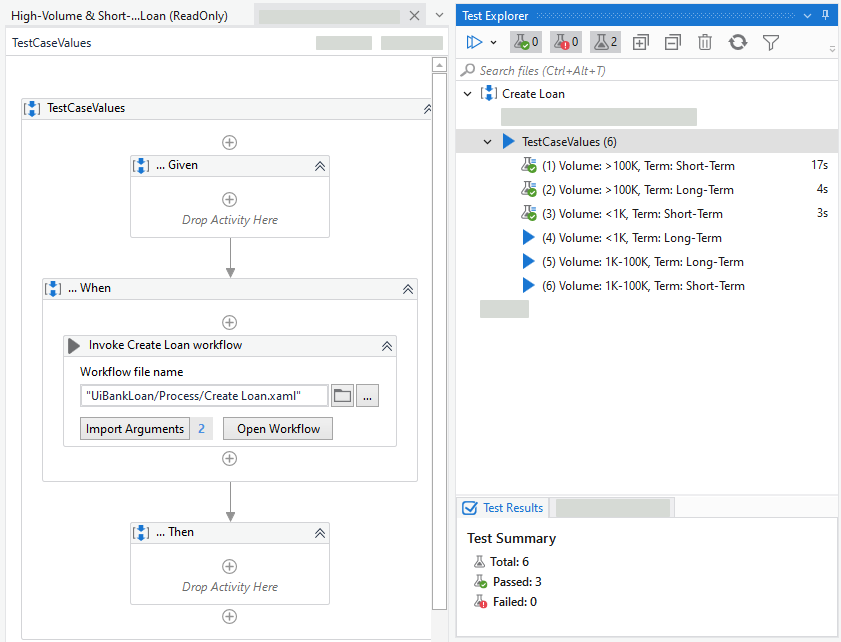
Within a Process project, both test cases and workflows are shown by default, whereas within a Test Automation project, the Test Explorer panel shows, by default, only test cases . For example, if you have a data-driven test case, it shows up collapsed by default, with the number of variations placed under parentheses (e.g., TestCaseValues (6)).

Prerequisites
- Studio version 2021.10.1+
- Testing activities v1.4.3+
Conditions
- The Test Explorer displays the first 100 test cases from your Test Manager project. You can't search beyond these initial 100 test cases.
- Test Explorer results information is session-based. This means that if you close Studio the information shown in Test Explorer will be cleared.
- The test cases are listed in Test Explorer based on an execution order.
Working With Test Explorer
To show only relevant information, you can use the Test Explorer toolbar to filter test results based on result state. Additionally, you can use multiple options to run the test cases again.

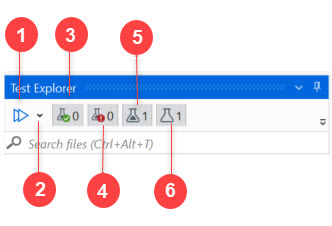
Test Explorer header
According to the image above, from left to right, you can take the following actions from the Test Explorer header:
- Run All test cases in View.
- Run or Debug test cases.
- Filter the panel based on passed test cases.
- Filter the panel based on failed test cases.
- Filter the panel based on not executed test cases.
- Filter the panel based on manual test cases.
For example, you can use the contextual menu to add, update, and remove test data on your test cases.

Test case contextual menu
The table below lists the actions you can take in the contextual menu of a test case inside the Test Explorer.
| Action | Description |
|---|---|
| Run | Run the selected test case. |
| Debug | Debug the selected test case. |
| Add Test Data | Import a data variation source to the selected test case. |
| Show in Project Explorer | Show the selected test case in the Project panel. |
| Set Execution Template | Set an execution template for the selected test case. |
| Link to Test Manager | Link the selected test case to Test Manager. |
Test Explorer actions
The following table lists the actions that you can take in the Test Explorer panel.
| Action | Description |
|---|---|
| Run All in View |
|
| Passed Test Cases | Show only test cases that have passed. |
| Failed Test Cases | Show only test cases that have failed. |
| Not Executed Test Cases | Show only test cases that have not been executed. |
| Expand/Collapse | Expand or collapse all test cases. |
| Clear execution results | Clear all execution results shown in the Test Explorer Panel. |
| Refresh | Refresh the information shown in the Test Results panel. You can also use this action to populate Test Explorer with newly added test cases. |
| Filter by File Type | Choose what to show in the Test Explorer panel. |
| Filter by Editing Status | Choose whether you want to show in progress test cases or workflows that have been ignored from execution. |
| Filter by Display Options | Choose whether to show activity coverage or execution time. |
| Filter by Covered/Uncovered Activities | Choose whether to show in the Designer panel the activities that have been covered during the execution. |
| Search Tests | Use the search function to look for test case names. |
Check out the following additional actions: To view test summary (e.g. view passes/failed test cases), see Test Results. To check which activities have been covered during execution, see Activity Coverage.