- Before you begin
- Managing access
- Getting started
- Integrations
- Working with process apps
- Working with dashboards and charts
- Working with process graphs
- Working with Discover process models and Import BPMN models
- Showing or hiding the menu
- Context information
- Export
- Filters
- Sending automation ideas to UiPath® Automation Hub
- Tags
- Due dates
- Compare
- Conformance checking
- Process simulation
- Root cause analysis (Preview)
- Simulating automation potential
- Starting a Task Mining project from Process Mining
- Triggering an automation from a process app
- Viewing Process data
- Process Insights (preview)
- Creating apps
- Loading data
- Transforming data
- Autopilot™ for SQL (preview)
- Structure of transformations
- Tips for writing SQL
- Exporting and importing transformations
- Viewing the data run logs
- Merging event logs
- Configuring Tags
- Configuring Due dates
- Configuring fields for Automation potential
- Activity Configuration: Defining activity order
- Making the transformations available in dashboards
- Data models
- Adding and editing processes
- Customizing dashboards
- Publishing process apps
- App templates
- Notifications
- Additional resources
Process Mining user guide
Introduction
Data manager enables you to adapt the data used in your process app based on custom data understanding and to create new KPI's. With Data manager you can edit data fields and add or edit metrics to change the display names used in your app as well as toggling their visibility.
Data manager is integrated in the dashboard editor. Refer to Working with the dashboard editor for more information.
Opening Data manager
Select the Open/Close Data manager icon in the dashboard editor to open Data manager. The Data manager panel is displayed, showing all data fields and metrics for each table available in your process app. The Data manager button is a toggle button. If the Data manager panel is displayed, selectthe Data manager button again to hide the Data manager panel.
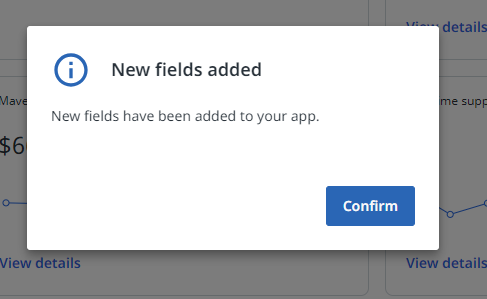
New fields added notification
When new fields are added in the data transformations, a notification message is displayed when you open Data manager. Select Confirm to continue.

The new fields are marked with a blue dot. You can use the new fields in the dashboard charts.
Make sure you check the Source field and the Type for the new fields.
Once the process app is published with the new fields, the blue dots are no longer displayed.
Refer to Data transformations editor for more information.
Searching available fields and metrics
To easily find a particular field or metric, you can search for available fields and metrics.
To search for available fields and metrics, start entering the name of the field or metric you want to find in the Search... field.
The matching fields and metrics are displayed.
You can also type a part of the name or a word that is in the name of the field or metric.
Expanding or collapsing the list of fields and metrics
| Select... | to... |
|---|---|
| expand all tables and display all the fields and metrics available. | |
| collapse all tables and hide all the available fields and metrics. | |
| expand the table and display the content. | |
| collapse the table and hide the content. |
Hiding or showing empty fields
The Show empty fields option enables you to show or hide fields for which your dataset does not contain any data.
By default, Show empty fields is selected, which means that empty fields are displayed in the list.