- Introduction
- Setting up your account
- Balance
- Clusters
- Concept drift
- Coverage
- Datasets
- General fields
- Labels (predictions, confidence levels, label hierarchy, and label sentiment)
- Models
- Streams
- Model Rating
- Projects
- Precision
- Recall
- Annotated and unannotated messages
- Extraction Fields
- Sources
- Taxonomies
- Training
- True and false positive and negative predictions
- Validation
- Messages
- Access control and administration
- Manage sources and datasets
- Understanding the data structure and permissions
- Creating or deleting a data source in the GUI
- Preparing data for .CSV upload
- Uploading a CSV file into a source
- Creating a dataset
- Multilingual sources and datasets
- Enabling sentiment on a dataset
- Amending dataset settings
- Deleting a message
- Deleting a dataset
- Exporting a dataset
- Using Exchange integrations
- Model training and maintenance
- Understanding labels, general fields, and metadata
- Label hierarchy and best practices
- Comparing analytics and automation use cases
- Turning your objectives into labels
- Overview of the model training process
- Generative Annotation
- Dastaset status
- Model training and annotating best practice
- Training with label sentiment analysis enabled
- Understanding data requirements
- Train
- Introduction to Refine
- Precision and recall explained
- Precision and Recall
- How validation works
- Understanding and improving model performance
- Reasons for label low average precision
- Training using Check label and Missed label
- Training using Teach label (Refine)
- Training using Search (Refine)
- Understanding and increasing coverage
- Improving Balance and using Rebalance
- When to stop training your model
- Using general fields
- Generative extraction
- Using analytics and monitoring
- Automations and Communications Mining™
- Developer
- Uploading data
- Downloading data
- Exchange Integration with Azure service user
- Exchange Integration with Azure Application Authentication
- Exchange Integration with Azure Application Authentication and Graph
- Migration Guide: Exchange Web Services (EWS) to Microsoft Graph API
- Fetching data for Tableau with Python
- Elasticsearch integration
- General field extraction
- Self-hosted Exchange integration
- UiPath® Automation Framework
- UiPath® official activities
- How machines learn to understand words: a guide to embeddings in NLP
- Prompt-based learning with Transformers
- Efficient Transformers II: knowledge distillation & fine-tuning
- Efficient Transformers I: attention mechanisms
- Deep hierarchical unsupervised intent modelling: getting value without training data
- Fixing annotating bias with Communications Mining™
- Active learning: better ML models in less time
- It's all in the numbers - assessing model performance with metrics
- Why model validation is important
- Comparing Communications Mining™ and Google AutoML for conversational data intelligence
- Licensing
- FAQs and more

Communications Mining user guide
Monitoring
Tone analysis
You must have assigned the IXP Project Admin role as an Automation Cloud user, or Modify datasets permission as a legacy user.
Tone analysis is the process of understanding and identifying the emotional tone or attitude expressed in a message.
The primary purpose of tone analysis is to gain insights into the emotional state of the writer to understand how they're feeling about a specific subject or topic.
Leveraging the platform's tone analysis capabilities allows users to be proactive in customer experience management, and can help users anticipate and address customer needs based on the emotions expressed within their communications.
When to use tone and label sentiment
Label sentiment is typically only appropriate for customer feedback related datasets. This is because they contain many more identifiable expressions of sentiment than other datasets, which tend to be much more neutral by nature.
For all other use cases, such as email inbox analysis and automation, tone should be used because the emotional tone expressed in a message may not simply be a positive versus a negative sentiment. It could be a complex spectrum of emotions, better represented by a scoring system. The majority of communications in these datasets are also neutral in tone, which is not captured by label sentiment analysis.
How it works
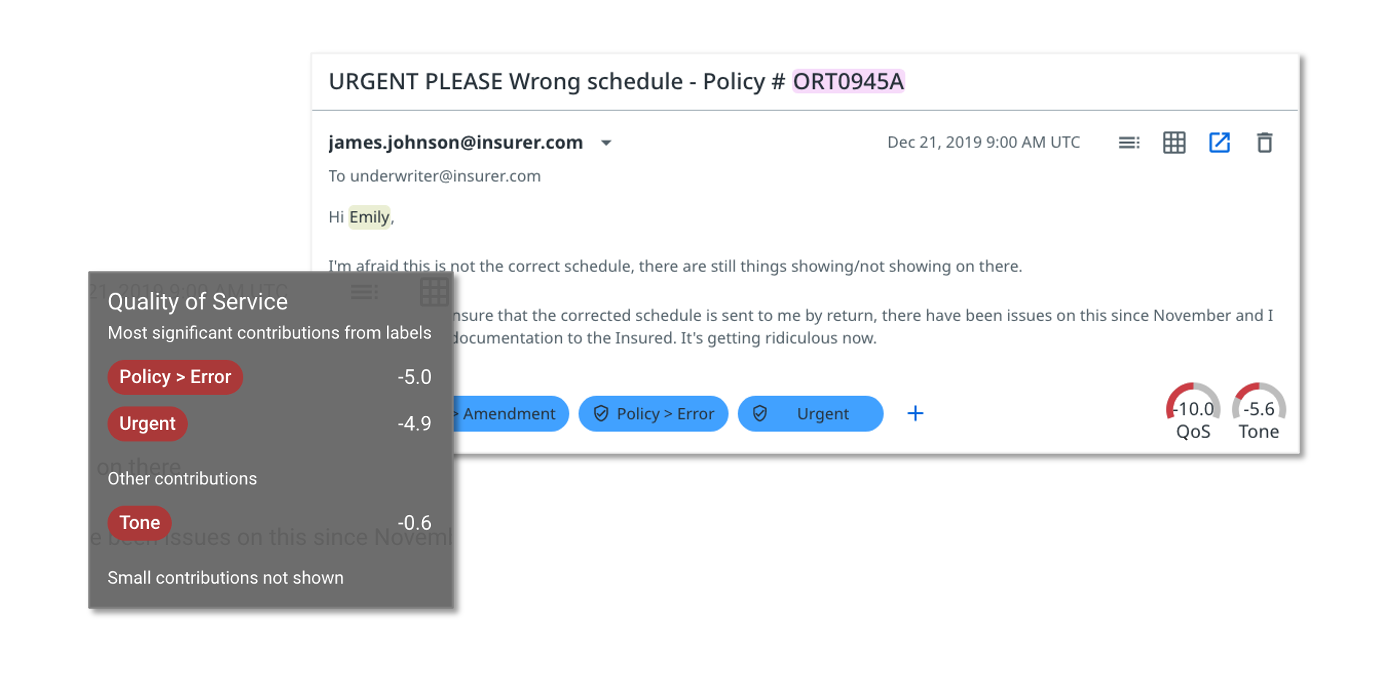
The tone model of Communications Mining™ is trained to look for specific expressions of sentiment, both positive and negative, and aggregates them up into an overall 'tone score' between -10 and 10.
This score then becomes a filterable or queryable property for each message, and can be aggregated up at different levels in Reports.
Additionally, the tone score is used as a contributing factor in generating Quality of Service (QoS) scores.
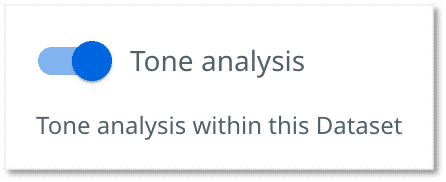
Setting up Tone analysis
Before you enable Tone analysis, make sure you have the required permissions to enable Quality of Service (QoS).
To enable Tone analysis, proceed as follows:
-
Navigate to the Datasets page.
-
Select the Settings tab.
-
Enable Tone analysis in the Datatset tab. You can perform this action any time.
Example of a message with Tone enabled
Quality of Service
You must have assigned the IXP Project Admin and IXP Model Trainer roles as an Automation Cloud user, or the Modify datasets and Review and label permissions as a legacy user.
The platform combines the overall sentiment, i.e. tone, and impact of intents in every message to automatically compute a configurable Quality of service (QoS) score for each message. It also enables real-time QoS dashboards and alerting based on predefined thresholds.
This functionality has many useful applications, including (but not limited to):
- Quality assurance across customer facing teams.
- Identification of prevalent customer issues & recovery opportunities.
- Performance monitoring and proactive customer interventions.
- Prioritization of the work and time management of agents.
The QoS feature helps to ensure that customers are provided with the highest quality of service, whilst identifying priority areas for improvement. It allows managers to measure the performance of agents, prioritize their work, and drive timely interventions.
How QoS works
The platform automatically calculates a Quality of Service (QoS) score between -10 and 10 for every message. It does this by combining the predicted tone score (also -10 to 10) with the combined impact scores across label predictions, weighted by prediction confidence.
Label impacts make up the majority of the QoS score, with tone representing ~10% of the score.
Setting up QoS
Before you enable Quality of service (QoS), make sure you have the required permissions:
- For Automation Cloud users:
- Dataset - Manage to enable QoS.
- Dataset - Review to add pre-trained labels.
- For legacy users:
- Modify datasets to enable QoS.
- Review and label to add pre-trained labels.
To enable Quality of service, proceed as follows:
-
Navigate to the Datasets page.
-
Select the Settings tab.
-
Enable Quality of service in the Datatset tab. You can perform this action any time.
-
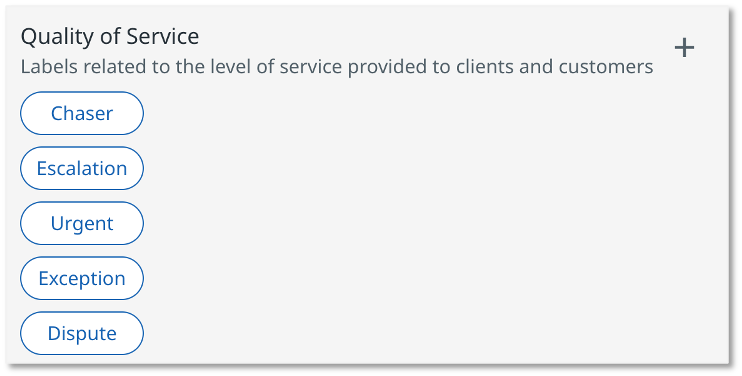
Turn on pre-trained labels, on key QoS intents that are applicable to your use case. You can make these labels trainable or non-trainable.
-
Turn on Tone analysis in the Datasets Settings page, where tone is incorporated into the QoS score.
-
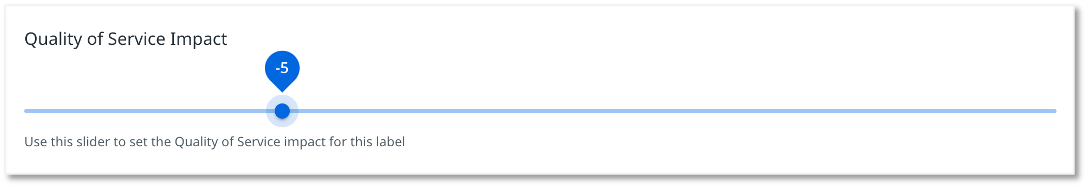
Change the label impacts. Every label can be assigned an impact score from -10 to +10, many are typically left at 0. You can change the QoS label impact by selecting into the settings of a label, through the Explore tab, on the taxonomy bar, and adjusting the QoS slider on a label.
Tracking and monitoring
![]()
You can use QoS within the following Communications Mining™ product features:
- Charts - Charts displaying QoS are available in the Label Summary, Trends, and Segments tabs within Reports, and they can all be added to dashboards for monitoring.
- Filters - QoS and tone scores become a property of each message, meaning they can be filtered on in Reports and Explore.
- Explore - There are sort orders in Explore for QoS and Tone, allowing users to explore qualitative examples of high and low scoring messages.
- Alerts - QoS and tone can be filter inputs to alerts, and alert types are available for tracking changes in QoS scores.
Example of a message with QoS enabled

Alert Center
Although issues are part of the IXP Administration page, they are specific to Communications Mining™ projects.
- You must have the View Alerts and Alerts Admin permissions assigned to view and manage alerts and issues.
- All users have the View Alerts permission by default, and are able to view all alerts and issues.
- All users who created at least one project have the Alerts Admin permission enabled by default.
Alerts overview
The platform provides real-time alerting capabilities, so you can define issues that impact your clients, processes, and service quality. Moreover, the platform alerts you each time issues such as risk events, client complaints, long-running issues, breaks, and so on occur. Such notifications are currently available only on the platform.
The alerts functionality has many useful applications, including:
- Communications volume and quality of service monitoring.
- Prioritisation and resolution of issues as soon as they occur.
- Triggering downstream automation.
- Keeping an audit trail of resolved issues and tracking of unresolved issues.
The Alerts feature provides visibility into the recurring or high-risk issues in your communication channels. In addition, Alerts allows you to monitor unresolved issues. Once the issue is fixed, you can mark it as resolved.
Alert Center overview
To view issues or alerts, select the Alert Center tab in the Administration page. Then select the Issues or Alerts tabs. Once you set up your alerts, these trigger issues when their criteria is met, and are tracked in the Issues tab.
Active issues track how many times an alert was triggered while the issue remained unresolved. After you investigate and address an issue, you can then mark it as resolved. If the alert triggers again in the future, the platform creates a new issue.
Setting up an alert
The following alert types are currently available:
- Alerts linked to email volumes. These focus on communications volume monitoring, for example, the number of exceptions or errors, or any instance of a specific high-risk event.
- Alerts linked to average quality of service (QoS) scores. These focus on service quality monitoring, for example, changes in the QoS score for our high-risk or high-value customers.
To create and configure a new alert, proceed as follows:
- Go to the Alert Center in the Administration page.
- Select the Alerts tab, and then select the New alert button.
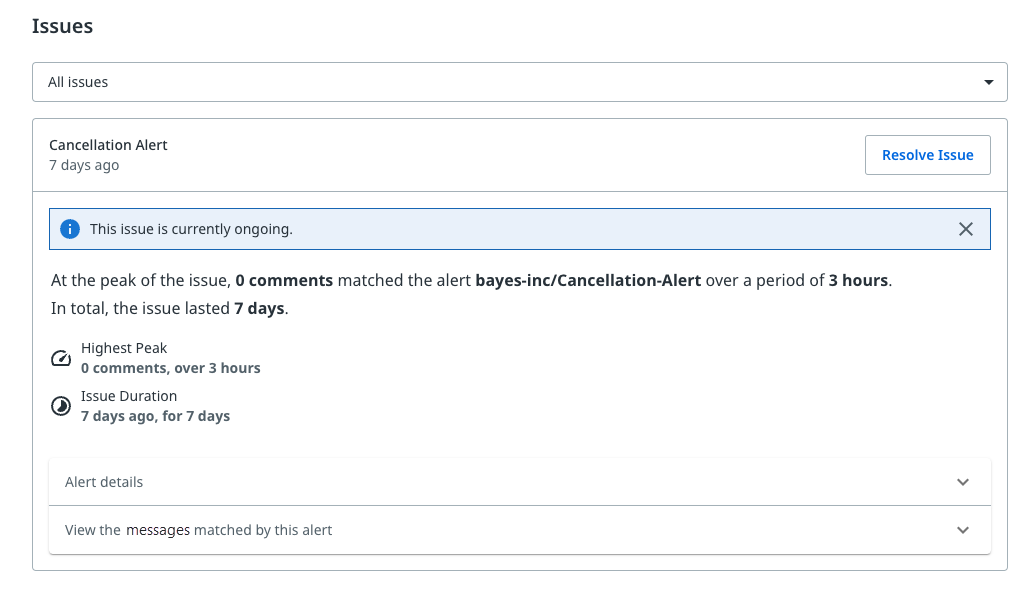
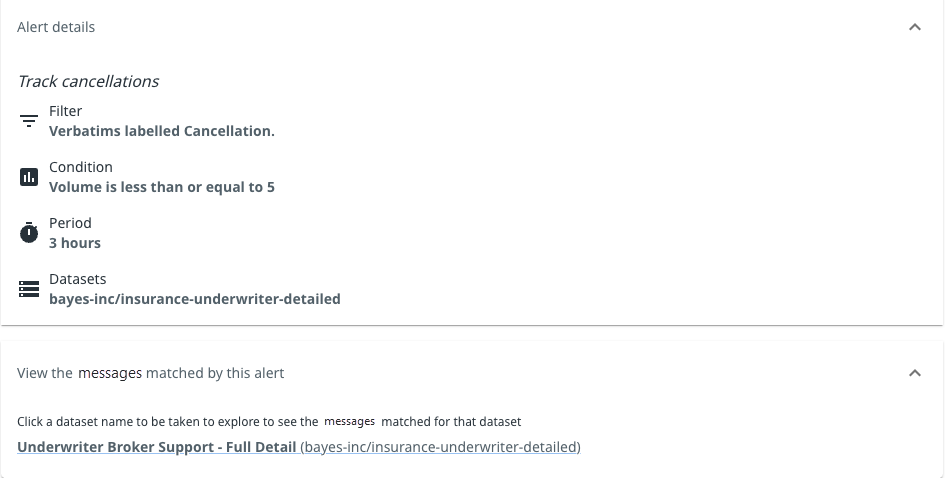
Alert details + matched messages example
 3. On the configuration page, specify the following details for each alert:
- The relevant project.
- The relevant dataset.
- The alert name.
- The applicable filters.
Note:
The applicable filters are the same filters available in the Explore or Reports tabs, for example, label filters or user property filters. If no filters are applied, the alert is triggered on the entire dataset.
Alert configuration window
 4. Link your alert to one or more datasets.
Alerts are linked to a primary dataset, to determine the available label filters, and then to any number of additional datasets that you have access to within the tenant.
-
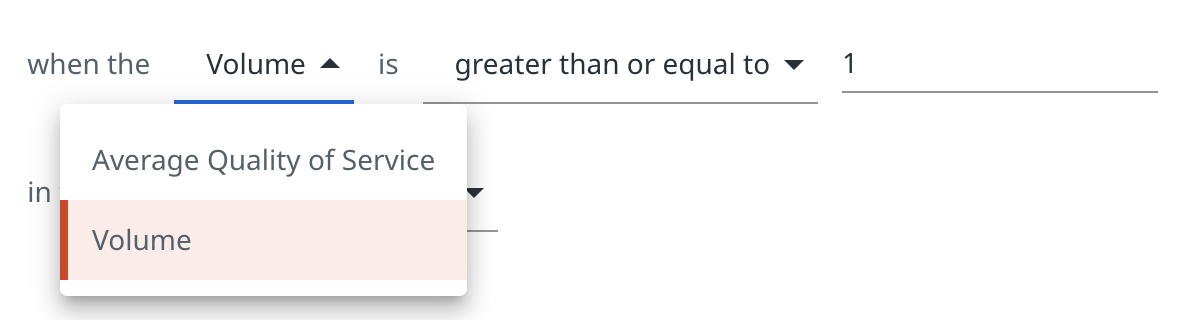
Select the alert type, Average Quality of Service or Volume, to customize individual conditions of the alert based on your business needs and objectives.
-
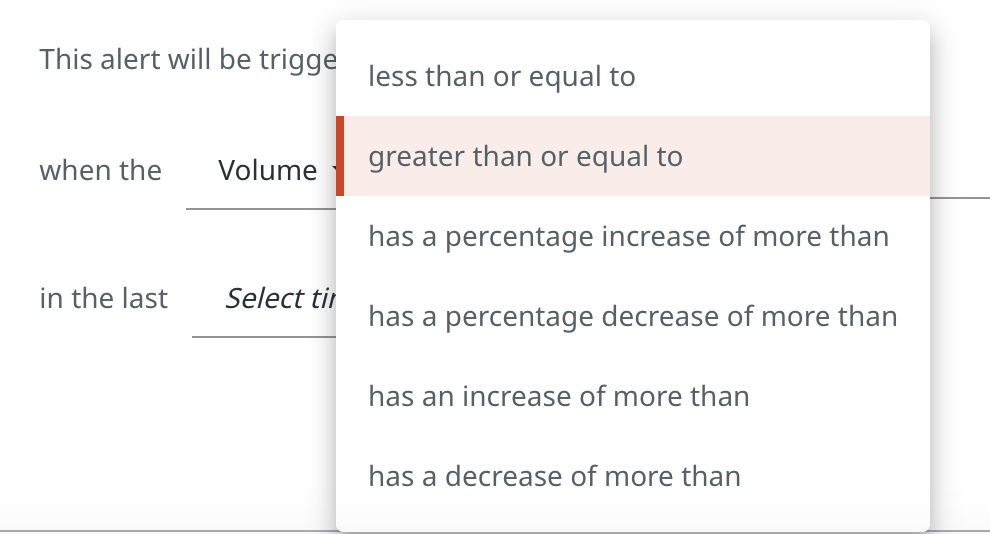
Indicate the level of increase or decrease, and then specify the exact value or percentage.
-
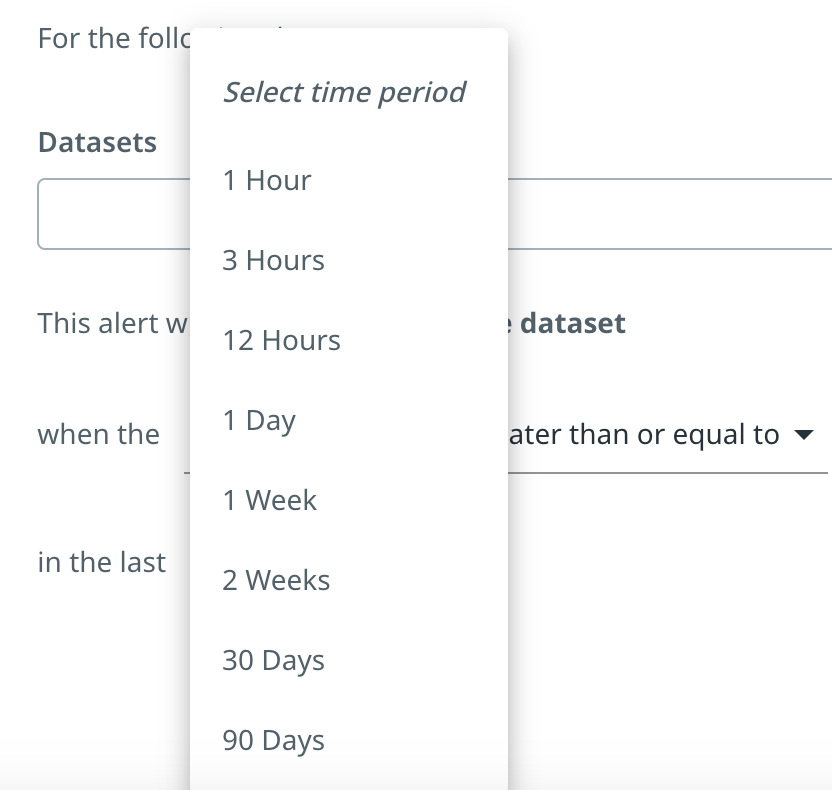
Select the time period you prefer.
-
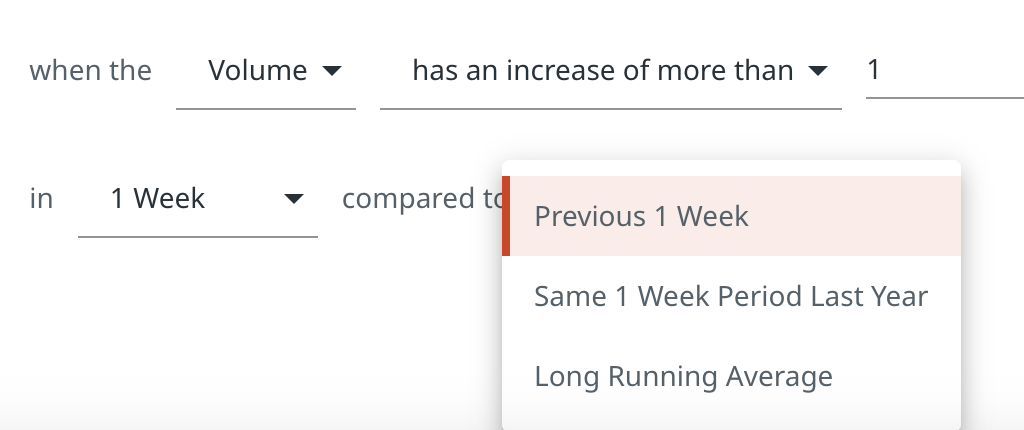
Define your ideal benchmark comparison:
-
Select the filters. You can apply the standard filters to determine which messages should be considered for each alert.
-
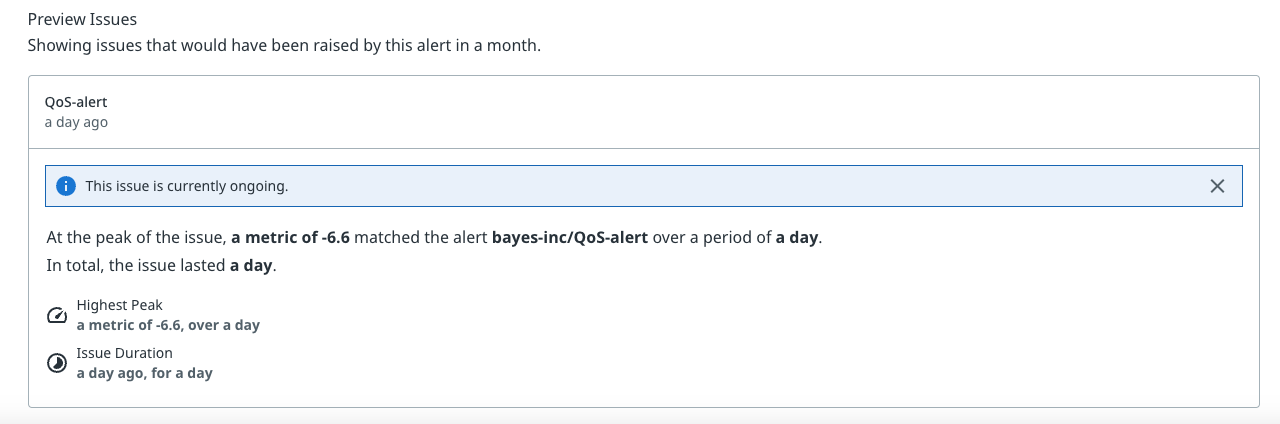
Select Preview alert to view how many times the alert would have been triggered in a past time period, for example, in six months.
Note:The Preview alert functionality is particularly helpful when you define the specific conditions of the alert to ensure the platform does not create an overly sensitive alert, or one that is never triggered
-
Select Create alert.
The alert configuration page
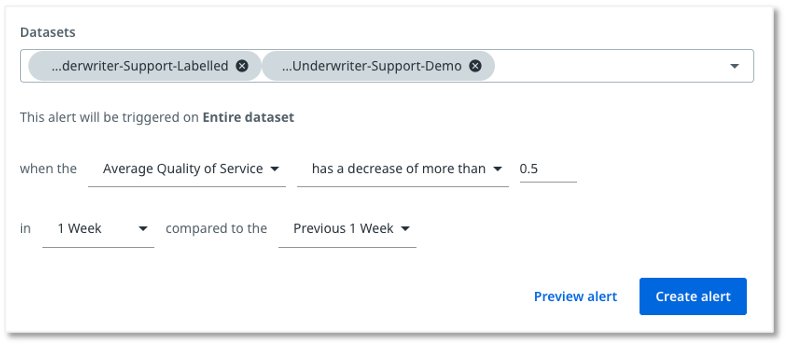

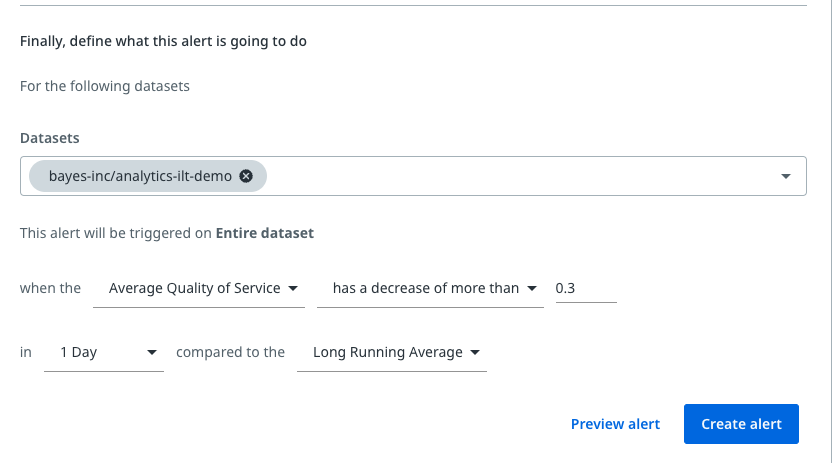
Example of a Quality of Service (QoS) alert
The objective of this example is to create an alert that gets triggered each time the average QoS score drops by 0.3 within a single day, compared to the long running average.
-
When you configure your alert, select the Average Quality of Service alert type from the drop-down list, in the Datasets section.
-
Select has a decrease of more than from the drop-down list.
-
Enter 0.3 in the free-text field.
-
Select 1 day.
-
Select long running average.
-
Select Preview alert.
-
Select Create alerts.
This particular alert would have triggered one issue in this period, and the issue would still be ongoing.
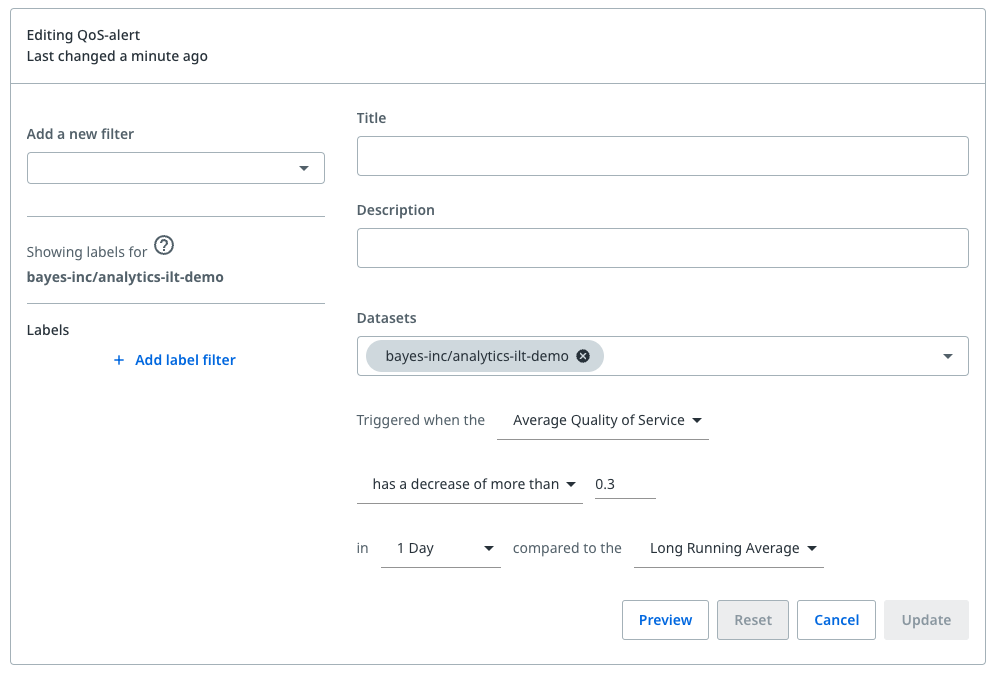
Editing and deleting alerts
To edit or delete an alert:
-
Go to the Alert Center in the Administration page.
-
Select the Alerts tab.
-
Select the pencil icon on an alert to edit it, or select the bin icon on an alert to delete it.

Edit Alert window
Tracking and monitoring
You can use the quality of service (QoS) within the following Communications Mining™ product features:
- Issues tab: This page tracks all active unresolved issues as well as past resolved issues, and provides an audit log of past issues.
- Resolving issues: Active issues count the number of times the issue has been triggered until that point. Once you address the issue, an alert administrator can mark it as resolved.
- Explore examples: When an alert triggers an issue, the issue card allows you to select examples of messages that cause the alert to trigger the issue, which allow investigation and resolution.
- In-platform: Currently, issues are only tracked in-platform, but will be available through API in future releases.
Tracking and resolving alert-triggered issues
You can view in the Issues tab all identified issues that the alerts triggered. However, you can filter by the active or resolved issues:
- Active issues: This filter allows you to track all unresolved issues.
- Resolved issues: This filter allows you to keep an audit trail of all past issues
Once you investigate and fix an active issue, you can marked it as Resolved. You can reopen it, if needed.
Additionally, each issue contains relevant alert details, as well as all messages that match the alert. You can access the issue details if you select the respective arrow icons on the issue card.
Subscribing to alerts
To subscribe to alert notifications, proceed as follows:
- Select the Alert Center tab on the Administration page.
- Select the Alerts tab.
- Select the Subscribe button on a specific alert.
To unsubscribe from alerts, select the Subscribed button on an alert and select Unsubscribed from the drop-down list.
Filter the alerts you subscribed to through the Subscribed filter from Alert Center.
- You can still select users when you edit the alert.
- You can still unsubscribe from an alert if you do not have the permission to view that alert.
- You do not need the Alerts Read permission to be subscribed to an alert by an alert administrator.
Although issues are part of the IXP Administration page, they are specific to Communications Mining™ projects.
- Tone analysis
- When to use tone and label sentiment
- How it works
- Setting up Tone analysis
- Example of a message with Tone enabled
- Quality of Service
- How QoS works
- Setting up QoS
- Tracking and monitoring
- Example of a message with QoS enabled
- Alert Center
- Alerts overview
- Alert Center overview
- Setting up an alert
- Example of a Quality of Service (QoS) alert
- Editing and deleting alerts
- Tracking and monitoring
- Tracking and resolving alert-triggered issues
- Subscribing to alerts