- Before you begin
- Managing access
- Getting started
- Integrations
- Working with process apps
- Working with dashboards and charts
- Working with process graphs
- Working with Discover process models and Import BPMN models
- Showing or hiding the menu
- Context information
- Export
- Filters
- Sending automation ideas to UiPath® Automation Hub
- Tags
- Due dates
- Compare
- Conformance checking
- Process simulation
- Root cause analysis (Preview)
- Simulating automation potential
- Starting a Task Mining project from Process Mining
- Triggering an automation from a process app
- Viewing Process data
- Process Insights (preview)
- Creating apps
- Loading data
- Transforming data
- Autopilot™ for SQL (preview)
- Structure of transformations
- Tips for writing SQL
- Exporting and importing transformations
- Viewing the data run logs
- Merging event logs
- Configuring Tags
- Configuring Due dates
- Configuring fields for Automation potential
- Activity Configuration: Defining activity order
- Making the transformations available in dashboards
- Data models
- Adding and editing processes
- Customizing dashboards
- Publishing process apps
- App templates
- Dashboards and KPIs
- Notifications
- Additional resources
Process Mining user guide
Overview dashboard
The Overview dashboard can be used to get a global overview of the data. It provides high-level case information.

Cases
Every single time an automation job is executed, it is considered as one case. A case (case id) is represented by a specific Job ID run. The cases displayed in the Automation Log Monitor are derived from the automation that was selected for the Automation Log Monitor when it was created.
KPIs
The following table describes the KPIs that are displayed on the Overview dashboard.
| KPI | Description |
|---|---|
| Variants | The number of various process paths different cases have taken from end to end. A variant is a specific path through the process, a set of activities that were taken in a specific order. Usually, several cases have followed the same variant. |
| Number of cases | The number of unique cases created during the selected period. |
| Open cases | The total number of open cases within the selected period. |
Dashboard charts
The following table describes the dashboard charts of the Overview dashboard.
| Chart | A history graph that displays... |
|---|---|
| Avg. throughput time | The average throughput time for the end-to-end process. |
| Error rate | The percentage of cases that executed with one or more errors. |
| First time right | The percentage of cases that executed first time right. |
Case analysis dashboard
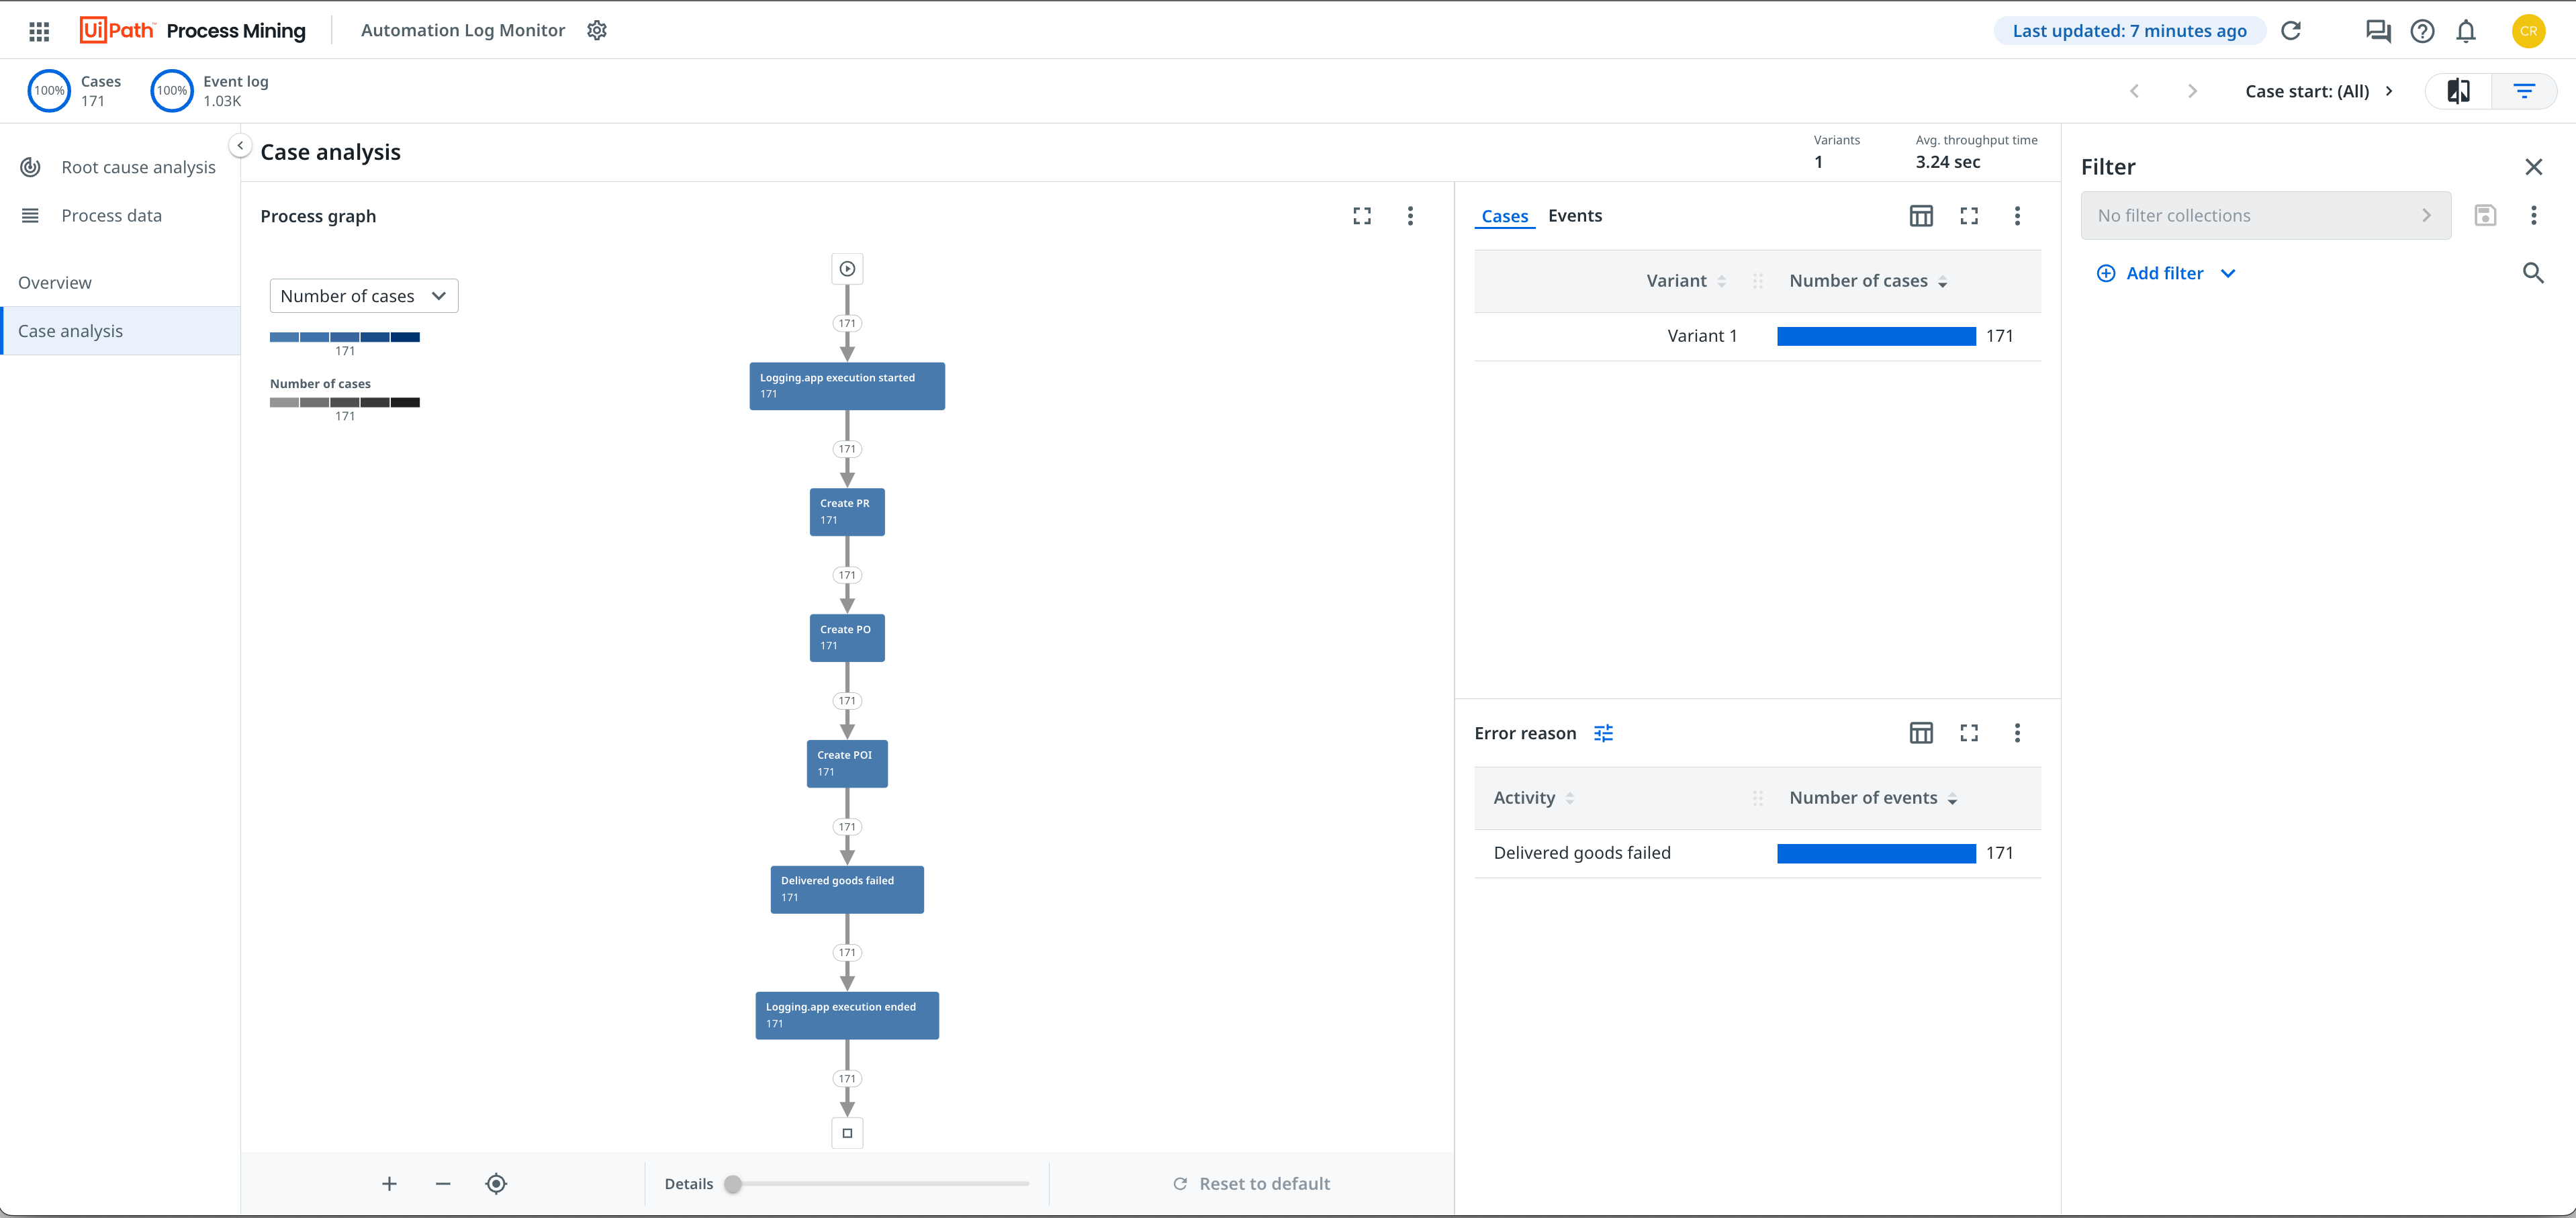
Case analysis is the main dashboard where you can analyze the overall process.

KPIs
The following table describes the KPIs that are displayed on the Case analysis dashboard.
| KPI | Description |
|---|---|
| Variants | The number of various process paths different cases have taken from end to end. A variant is a specific path through the process, a set of activities that were taken in a specific order. Usually, several cases have followed the same variant. |
| Avg. throughput time | The average throughput time for the end-to-end process. |
| Number of cases | The number of unique cases for the end-to-end process. |
Process graph
The process graph displays the end-to-end process based on the number of cases.
You can select a different metric from the metric selector to display the process graph based on a different metric. The following table describes the available metrics.
| Metric | Description | Base |
|---|---|---|
| Number of cases | The number of unique cases. | Cases |
| Avg. event throughput time | The average throughput time for the end-to-end process. | Event log |
| Total event throughput time | The total throughput time for the end-to-end process. | Event log |
Cases and Events
The Cases and Events bar charts enable you to monitor the various aspects of the automated process. You can change the data in the bar charts by selecting the different fields and/or metrics.
Every single time an automation job is executed, it is considered as one case. A case (case id) is represented by a specific Job ID run. An event refers to an action or occurrence during the automation run. Each event is represented by a corresponding Robot Log message associated with a Job run.
Error reason
The Error reason chart displays the number of events for activities that represent errors in the process.
Data refresh
In the header bar it is indicated when the data was last updated.
To refresh the data, select the refresh icon  to refresh the data used in the Automation Log Monitor dashboards.
When you refresh the data for the Automation Log Monitor, data from the past 30 days is re-ingested. The previously loaded data will be replaced by the new data and the app will have the last 30 days of data.
If the process that has not been executed in the last 30 days, a message is displayed indicating that no data is available. If you select to continue re-ingest data, the data run will fail and the previous data will be used in the dashboards.