- Getting Started
- Setup and Configuration
- Automation Projects
- Dependencies
- Types of Workflows
- Control Flow
- File Comparison
- Automation Best Practices
- Source Control Integration
- Debugging
- Logging
- The Diagnostic Tool
- Workflow Analyzer
- About Workflow Analyzer
- ST-NMG-001 - Variables Naming Convention
- ST-NMG-002 - Arguments Naming Convention
- ST-NMG-004 - Display Name Duplication
- ST-NMG-005 - Variable Overrides Variable
- ST-NMG-006 - Variable Overrides Argument
- ST-NMG-008 - Variable Length Exceeded
- ST-NMG-009 - Prefix Datatable Variables
- ST-NMG-011 - Prefix Datatable Arguments
- ST-NMG-012 - Argument Default Values
- ST-NMG-016 - Argument Length Exceeded
- ST-NMG-017 - Class name matches default namespace
- ST-DBP-002 - High Arguments Count
- ST-DBP-003 - Empty Catch Block
- ST-DBP-007 - Multiple Flowchart Layers
- ST-DPB-010 - Multiple instances of [Workflow] or [Test Case]
- ST-DBP-020 - Undefined Output Properties
- ST-DBP-021 - Hardcoded Timeout
- ST-DBP-023 - Empty Workflow
- ST-DBP-024 - Persistence Activity Check
- ST-DBP-025 - Variables Serialization Prerequisite
- ST-DBP-027 - Persistence Best Practice
- ST-DBP-028 - Arguments Serialization Prerequisite
- ST-USG-005 - Hardcoded Activity Properties
- ST-USG-009 - Unused Variables
- ST-USG-010 - Unused Dependencies
- ST-USG-014 - Package Restrictions
- ST-USG-017 - Invalid parameter modifier
- ST-USG-020 - Minimum Log Messages
- ST-USG-024 - Unused Saved for Later
- ST-USG-025 - Saved Value Misuse
- ST-USG-026 - Activity Restrictions
- ST-USG-027 - Required Packages
- ST-USG-028 - Restrict Invoke File Templates
- ST-USG-032 - Required Tags
- ST-USG-034 - Automation Hub URL
- Variables
- Arguments
- Imported Namespaces
- Coded automations
- Introduction
- Registering custom services
- Before and After contexts
- Generating code
- Generating coded test case from manual test cases
- Troubleshooting
- Trigger-based Attended Automation
- Object Repository
- The ScreenScrapeJavaSupport Tool
- Extensions
- About extensions
- SetupExtensions tool
- UiPathRemoteRuntime.exe is not running in the remote session
- UiPath Remote Runtime blocks Citrix session from being closed
- UiPath Remote Runtime causes memory leak
- UiPath.UIAutomation.Activities package and UiPath Remote Runtime versions mismatch
- The required UiPath extension is not installed on the remote machine
- Screen resolution settings
- Group Policies
- Cannot communicate with the browser
- Chrome extension is removed automatically
- The extension may have been corrupted
- Check if the extension for Chrome is installed and enabled
- Check if ChromeNativeMessaging.exe is running
- Check if ComSpec variable is defined correctly
- Enable access to file URLs and Incognito mode
- Multiple browser profiles
- Group Policy conflict
- Known issues specific to MV3 extensions
- List of extensions for Chrome
- Chrome Extension on Mac
- Group Policies
- Cannot communicate with the browser
- Edge extension is removed automatically
- The extension may have been corrupted
- Check if the Extension for Microsoft Edge is installed and enabled
- Check if ChromeNativeMessaging.exe is running
- Check if ComSpec variable is defined correctly
- Enable access to file URLs and InPrivate mode
- Multiple browser profiles
- Group Policy conflict
- Known issues specific to MV3 extensions
- List of extensions for Edge
- Extension for Safari
- Extension for VMware Horizon
- Extension for Amazon WorkSpaces
- SAP Solution Manager plugin
- Excel Add-in
- Studio testing
- Troubleshooting
- About troubleshooting
- Assembly compilation errors
- Microsoft App-V support and limitations
- Internet Explorer X64 troubleshooting
- Microsoft Office issues
- Identifying UI elements in PDF with Accessibility options
- Repairing Active Accessibility support
- Validation of large Windows-legacy projects takes longer than expected

Studio user guide
Profile Execution
Overview
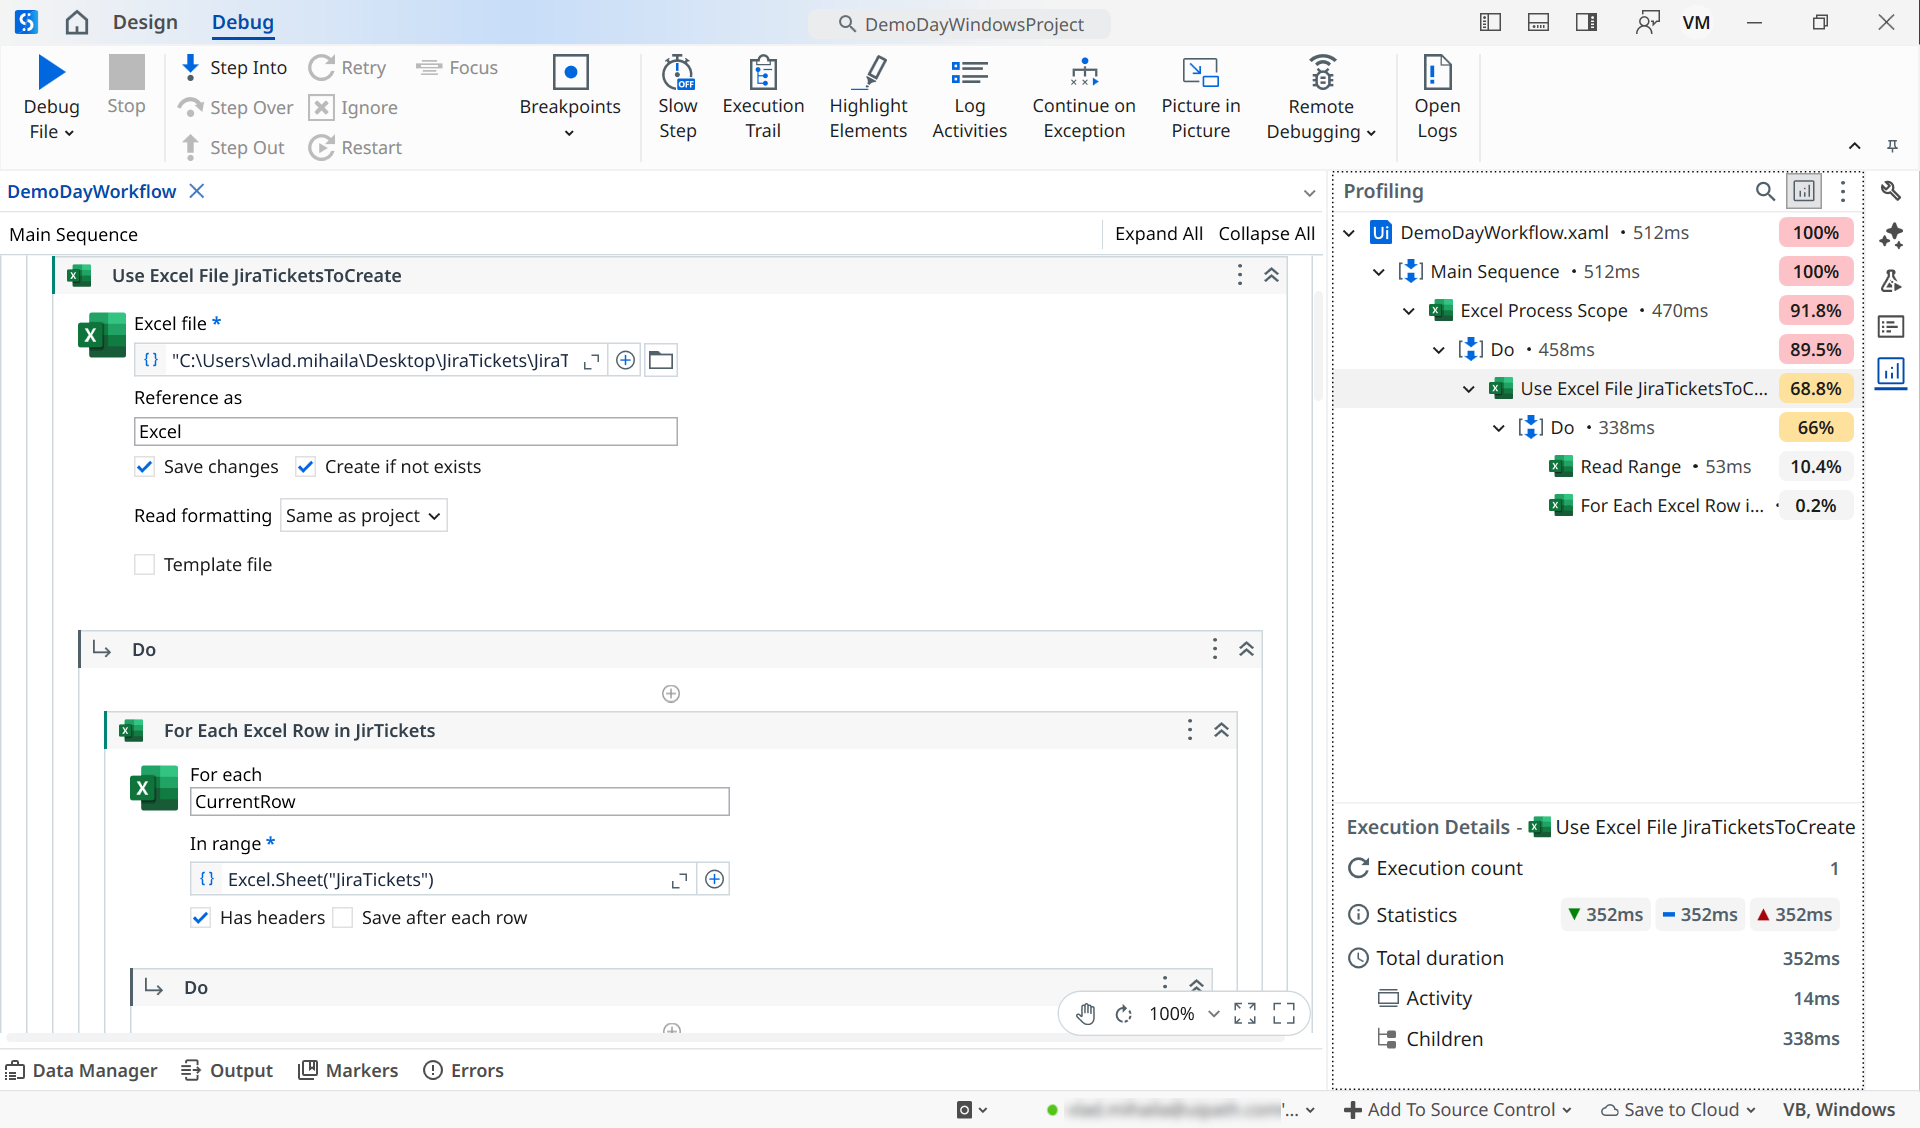
Profile Execution helps you spot performance bottlenecks during workflow executions rather than tracking the overall execution time. As you run or debug a workflow, it provides an analysis of each operation's performance, reflecting a cumulative percentage of every activity's execution time.
How it works
Profile execution involves execution duration, which is the time from the start of a workflow's first activity to the end of the last activity. For example, if your file contains a top level Sequence, it displays the total time taken for all the Sequence's activities to run.
When no workflow file is selected, the total duration displayed is the cumulative sum of all top-level durations, excluding Invoke Workflow activities.
Suppose you execute several test cases or regular workflow files that invoke the same file. The total duration might not match the actual execution time. However, the tool groups together the execution times from multiple runs of the invoked file. This grouping helps you spot occasional performance issues and generates run statistics. The primary purpose of profile execution is to identify activities that create delays in workflow execution.

Considerations
- Profiling data generated during debugging might be different from data generated during production (running the file).
- The data is stored for each session in
C:\Users\username\AppData\Local\UiPath\ProfiledRuns(see Import previous profiling sessions).
Analyzing profiling results
To profile an execution, run a file or debug the file, then go to the Profiling panel.
Make sure that your automation works correctly without slow performing workflows. If you identify potential flow issues, you can review workflows that take longer to be completed. Use the context menu for profiling to take actions.
The Execution Details at the bottom of the Profiling panel shows the number of executions and descriptive statistics such as the average duration and the minimum and maximum duration values.
Import profiling session
You can import profiling sessions to examine previous runs. Focus is disabled on imported profiling sessions.
Context menu for profiling
| Action | Description |
|---|---|
| Open | Right-click the parent file in the Profiling panel and select Open to jump to the selected workflow. |
| Focus | Right-click an activity and select Focus to center the Designer panel view on the selected activity. |
| Search | Use the search function to look for specific activities. |
| Expand/Collapse All | Use Expand All and Collapse All to bring to view or collapse all activities. |