- Getting Started
- Setup and Configuration
- Automation Projects
- Dependencies
- Types of Workflows
- Control Flow
- File Comparison
- Automation Best Practices
- Source Control Integration
- Debugging
- Logging
- The Diagnostic Tool
- Workflow Analyzer
- About Workflow Analyzer
- ST-NMG-001 - Variables Naming Convention
- ST-NMG-002 - Arguments Naming Convention
- ST-NMG-004 - Display Name Duplication
- ST-NMG-005 - Variable Overrides Variable
- ST-NMG-006 - Variable Overrides Argument
- ST-NMG-008 - Variable Length Exceeded
- ST-NMG-009 - Prefix Datatable Variables
- ST-NMG-011 - Prefix Datatable Arguments
- ST-NMG-012 - Argument Default Values
- ST-NMG-016 - Argument Length Exceeded
- ST-NMG-017 - Class name matches default namespace
- ST-DBP-002 - High Arguments Count
- ST-DBP-003 - Empty Catch Block
- ST-DBP-007 - Multiple Flowchart Layers
- ST-DPB-010 - Multiple instances of [Workflow] or [Test Case]
- ST-DBP-020 - Undefined Output Properties
- ST-DBP-021 - Hardcoded Timeout
- ST-DBP-023 - Empty Workflow
- ST-DBP-024 - Persistence Activity Check
- ST-DBP-025 - Variables Serialization Prerequisite
- ST-DBP-027 - Persistence Best Practice
- ST-DBP-028 - Arguments Serialization Prerequisite
- ST-USG-005 - Hardcoded Activity Properties
- ST-USG-009 - Unused Variables
- ST-USG-010 - Unused Dependencies
- ST-USG-014 - Package Restrictions
- ST-USG-017 - Invalid parameter modifier
- ST-USG-020 - Minimum Log Messages
- ST-USG-024 - Unused Saved for Later
- ST-USG-025 - Saved Value Misuse
- ST-USG-026 - Activity Restrictions
- ST-USG-027 - Required Packages
- ST-USG-028 - Restrict Invoke File Templates
- ST-USG-032 - Required Tags
- ST-USG-034 - Automation Hub URL
- Variables
- Arguments
- Imported Namespaces
- Coded automations
- Introduction
- Registering custom services
- Before and After contexts
- Generating code
- Generating coded test case from manual test cases
- Troubleshooting
- Trigger-based Attended Automation
- Object Repository
- The ScreenScrapeJavaSupport Tool
- Extensions
- About extensions
- SetupExtensions tool
- UiPathRemoteRuntime.exe is not running in the remote session
- UiPath Remote Runtime blocks Citrix session from being closed
- UiPath Remote Runtime causes memory leak
- UiPath.UIAutomation.Activities package and UiPath Remote Runtime versions mismatch
- The required UiPath extension is not installed on the remote machine
- Screen resolution settings
- Group Policies
- Cannot communicate with the browser
- Chrome extension is removed automatically
- The extension may have been corrupted
- Check if the extension for Chrome is installed and enabled
- Check if ChromeNativeMessaging.exe is running
- Check if ComSpec variable is defined correctly
- Enable access to file URLs and Incognito mode
- Multiple browser profiles
- Group Policy conflict
- Known issues specific to MV3 extensions
- List of extensions for Chrome
- Chrome Extension on Mac
- Group Policies
- Cannot communicate with the browser
- Edge extension is removed automatically
- The extension may have been corrupted
- Check if the Extension for Microsoft Edge is installed and enabled
- Check if ChromeNativeMessaging.exe is running
- Check if ComSpec variable is defined correctly
- Enable access to file URLs and InPrivate mode
- Multiple browser profiles
- Group Policy conflict
- Known issues specific to MV3 extensions
- List of extensions for Edge
- Extension for Safari
- Extension for VMware Horizon
- Extension for Amazon WorkSpaces
- SAP Solution Manager plugin
- Excel Add-in
- Studio testing
- Troubleshooting
- About troubleshooting
- Assembly compilation errors
- Microsoft App-V support and limitations
- Internet Explorer X64 troubleshooting
- Microsoft Office issues
- Identifying UI elements in PDF with Accessibility options
- Repairing Active Accessibility support
- Validation of large Windows-legacy projects takes longer than expected

Studio user guide
The User Interface
Studio contains multiple panels for easier access to specific functionalities. They can be docked, act as floating windows, or the Auto Hide option can be enabled from the drop-down list.
Overview

| No. | Name | Description |
|---|---|---|
| 1 | Access the three main areas of Studio:
| |
| 2 |
| |
| 3 | Build your automation by managing the activities added to the current workflow file. | |
| 4 | Search within your project using the available search bars: | |
| 5 | Explorer Panel | View the contents of your current project, manage files, folders, and dependencies, and adjust project settings. |
| 6 | Activities Panel | View all available activities and add activities to your automation. |
| 7 | Object Repository Panel | Create and reuse UI taxonomies inside and across projects. |
| 8 | Snippets Panel | Use pre-built workflows and add your own reusable automations. |
| 9 | Source Control Panel | Access source control operations. |
| 10 | Data Manager Panel | Manage the data in your project. Contains the following panels:
|
| 11 | View the output of the Log message and Write Line activities, status information regarding the execution of your project, errors generated by activities packages, and more. | |
| 12 | Errors Panel | View all the errors generated when running the Workflow Analyzer. |
| 13 | Markers Panel | Manage breakpoints and bookmarks added to the project. |
| 14 | Find References Panel | View all the places where an element is referenced in your project. |
| 15 | Properties Panel | View and configure the properties of a selected activity. |
| 16 | Autopilot Panel | Use Autopilot functionalities. |
| 17 | View information related to test automation. | |
| 18 | Output Panel | View the hierarchy of the current workflow and all available nodes. |
| 19 | View status information and manage the Orchestrator connection and source control integration. |
The Ribbon
Ribbon Display Options
You can configure the ribbon to increase or decrease the space available for the Designer panel by clicking:
-
 Compact View to get a streamlined view of the ribbon.
-
 Standard View to see the full size of the ribbon.
You can also show or hide the ribbon by clicking:
 Pin the ribbon to always show the ribbon.
 Unpin the ribbon to only show the ribbon tabs. You can also right-click a pinned ribbon and select Collapse the Ribbon.
With the ribbon unpinned, several primary actions are moved from the ribbon tabs directly in the Title bar. These include:
-
Debug File
-
Save
-
Manage Packages
-
Wizards
-
Remove Unused
-
Analyze File
-
Publish
-
Debug Settings

Ribbon Tabs
The ribbon consists of the following three tabs:
-
Home - create and open projects, configure Studio, or access help and license information from the Studio Backstage View.
-
Design - add sequences, flowcharts, state machines, and long running workflows to your project, install and manage activities packages, build interactions with UI elements, export workflows to Excel, and then publish your work to Orchestrator or custom feeds. Keep in mind that wizards and UI Explorer aren't visible in the Ribbon unless you install the
UiPath.UIAutomation.Activitiespackage.
-
Debug - debug your workflow, while using debugging tools to set breakpoints, monitor the execution of activities step by step, and adjust the debugging speed. Open logs to view details regarding execution and any changes made to the project. For more information on debugging, check the About Debugging page.
 Note:
Note:Files that are not created during the execution of the automation project become read-only when published to Orchestrator. If your business process requires you to write in a specific file at some point, be sure to create it while designing the project.
The Title Bar
Show/hide groups of panels
You can show or hide a panel or groups of stacked panels by using one of the three buttons:
 for left panels.
 for bottom panels.
 for right panels.
Send Feedback
There are two types of feedback that you can send directly from within Studio: Submit an idea for the product or Report a bug. Both are accessible from the ribbon by clicking the  icon.
icon.
The Send Feedback feature can be used for sending anonymous feedback to the product team, but you can also include your email address to further discuss your feedback. To contact our tech support team, please use the Contact Technical Support form.
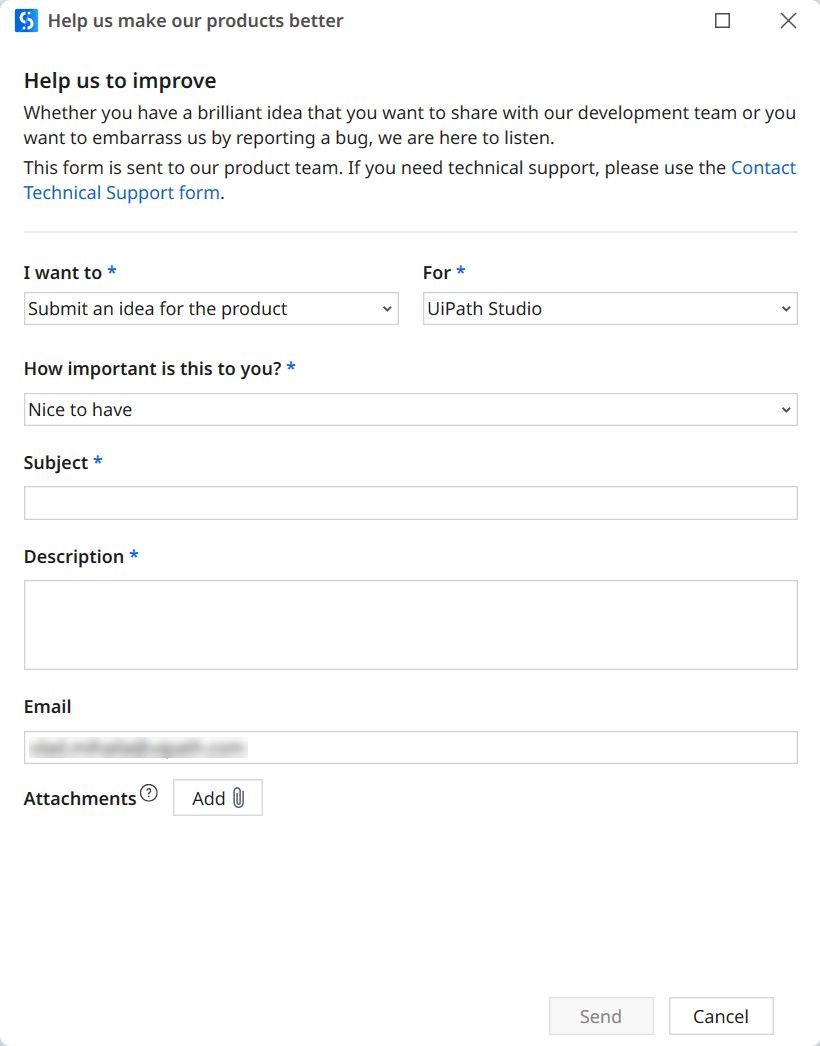
Provide the following information, and then click Submit:
- From the I want to drop-down menu, pick either Submit an idea for the product or Report a bug.
- From the For drop-down menu, pick either UiPath Activities, UiPath Studio, UiPath Robot, UiPath Orchestrator or UiPath Assistant.
- From the How important is this to you drop-down menu, pick Nice to have, Important, or Critical.
- In the Subject field, add a short title.
- Add a detailed description and attach up to 6 images, videos, or text files, each with a size smaller than 10MB. The threshold for sending feedback is three posts in a timeframe of five minutes.
Backstage View
This is the view you see when you first open Studio. You can also get here by clicking Home in the upper-left corner of the window. Here you can create and open projects, configure Studio, or access help and license information.
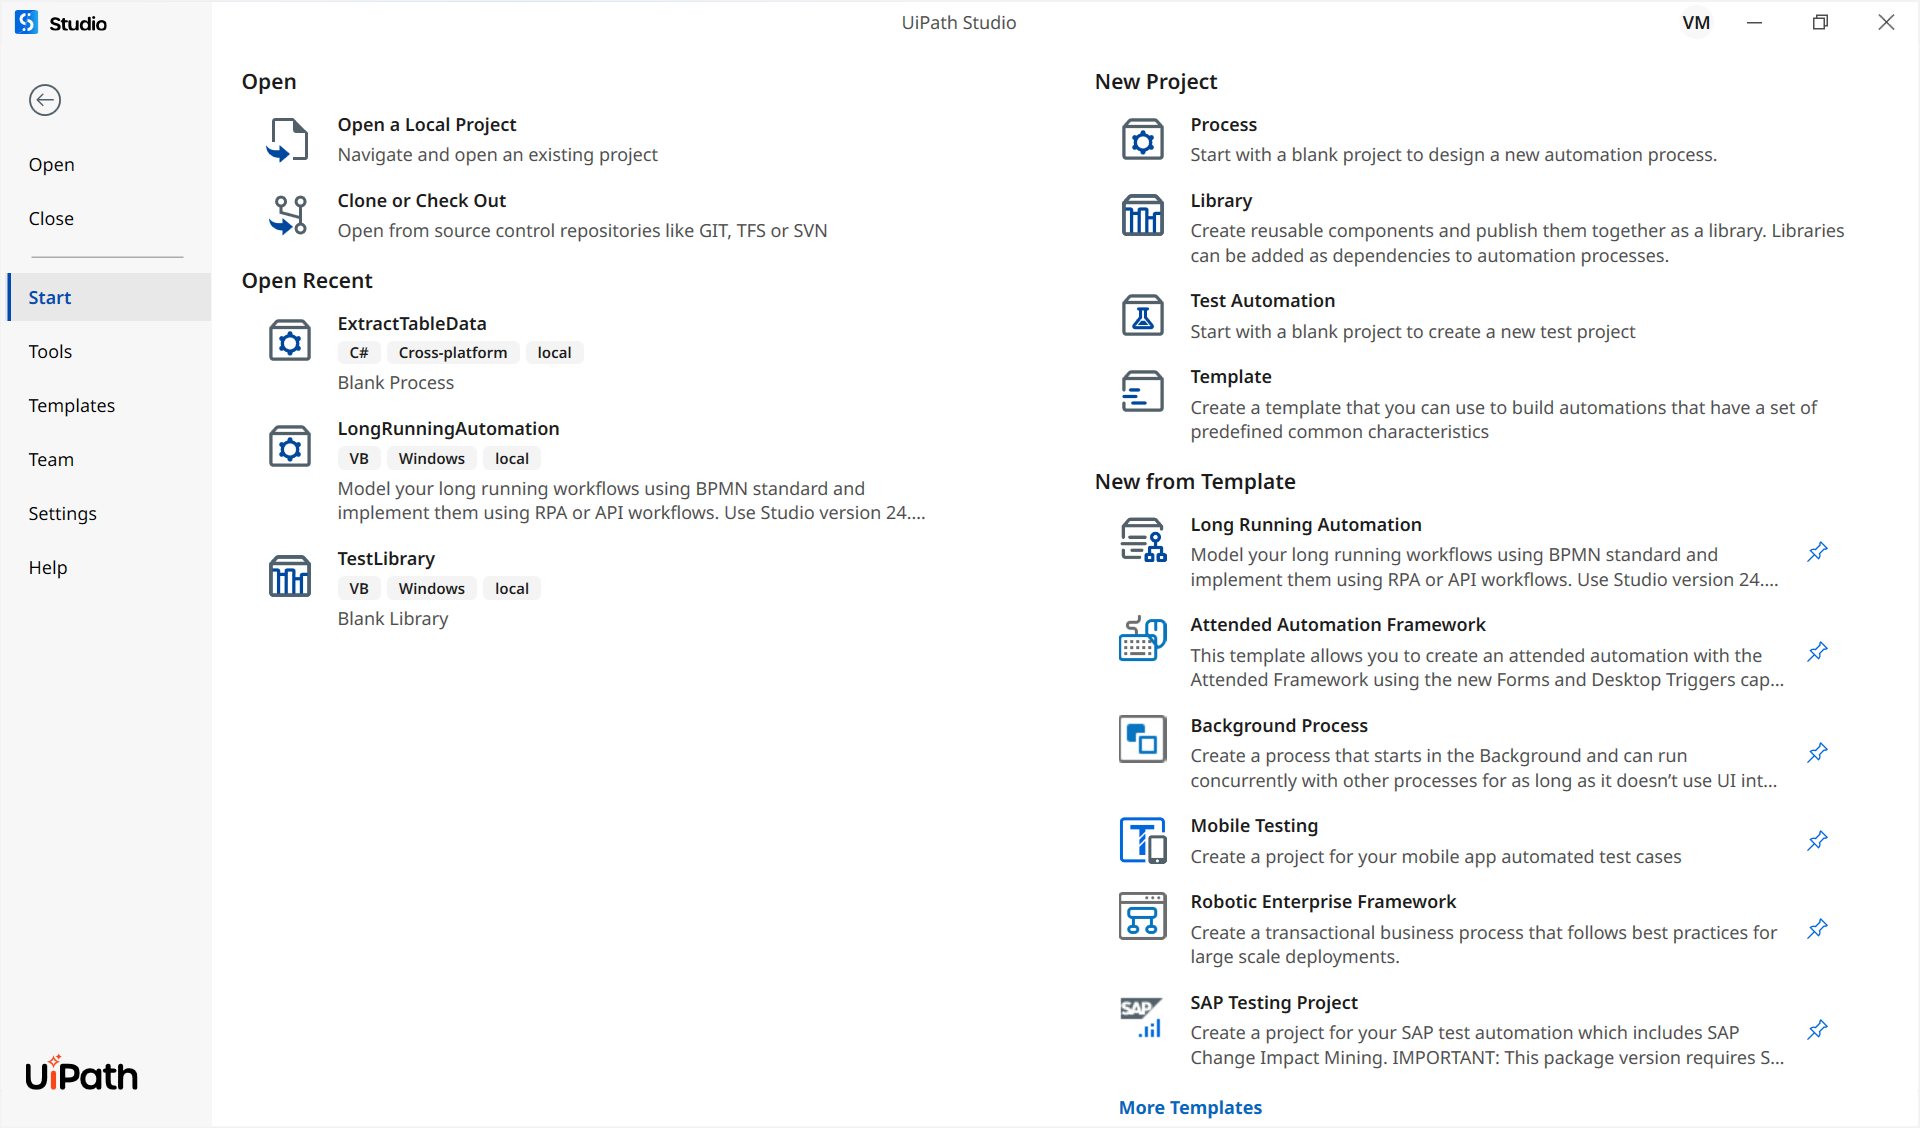
The following buttons and tabs are available in this view:
-
Open - Browse to a local automation project and open it. By default, projects are created in C:\Users<current_user>\Documents\UiPath.
Note:Projects located on network folders where your user only has read permissions cannot be opened in Studio. We recommend using source control systems to collaborate on projects.
-
Close - Close the automation project that is currently open.
-
Start - Create a new automation project or open recently accessed projects. You can create a new project from predefined templates or open a project you recently worked on. Projects can be pinned or removed from the Open Recent list, which displays the description, target framework, language used for expressions, and project source (local, Studio Web, or GIT/SVN/TFS repository) for each project. Hovering over an entry in the Open Recent list displays the path to the
project.jsonfile and when the project was last opened. -
Templates - Create a new project based on a template. In this tab, you can view all available project templates, search and filter them by source. For more information, see Project Templates.
-
Team - Manage source control integration for the automation project.
-
Tools - Access tools that enhance your experience with Studio.
- Select the Apps tab for the , Project Dependencies Mass Update Tool, and the Repair Tool for Microsoft Office.
- Select the UiPath Extensions tab to install or uninstall the following extensions: Chrome, Firefox, Edge, Java, Silverlight, Citrix, Windows Remote Desktop, VMware Horizon, Excel Add-in, and SAP Solution Manager.
- Select the Plugins tab to enable or disable source control and test automation plugins.
-
Settings - Change the look and feel of Studio, set global preferences, and manage activities package sources. For more information, see Configuring Studio Settings.
-
Help - Directs you to product documentation, release notes, online resources, the Community Forum and the RPA Academy. This is where you can also access a quick tutorial that helps you learn the basics of creating, publishing, and running an automation.
Note:To ensure the tutorial is completed successfully, we recommend that you pause the tutorial before making any changes to the workflow outside of those highlighted in the tutorial steps.
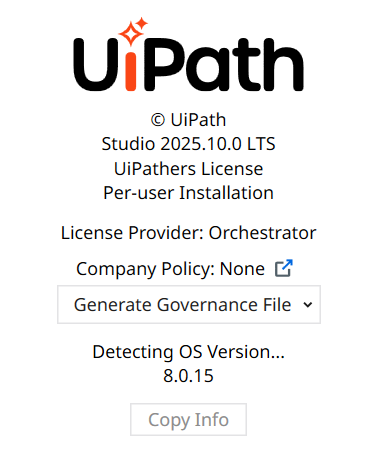
Information regarding product version and installation, license availability, and device ID is also found in the Help tab, together with a Copy Info button for quickly copying the details to the clipboard.
The Command Palette
The Command Palette is opened by using the Ctrl + Shift + P, F3 keyboard shortcuts, or by clicking the search button. It incorporates the Add activity, the Universal search, the Go to file, and Jump to activity search bars, as well as the Navigate forward and Navigate backward file navigation options.
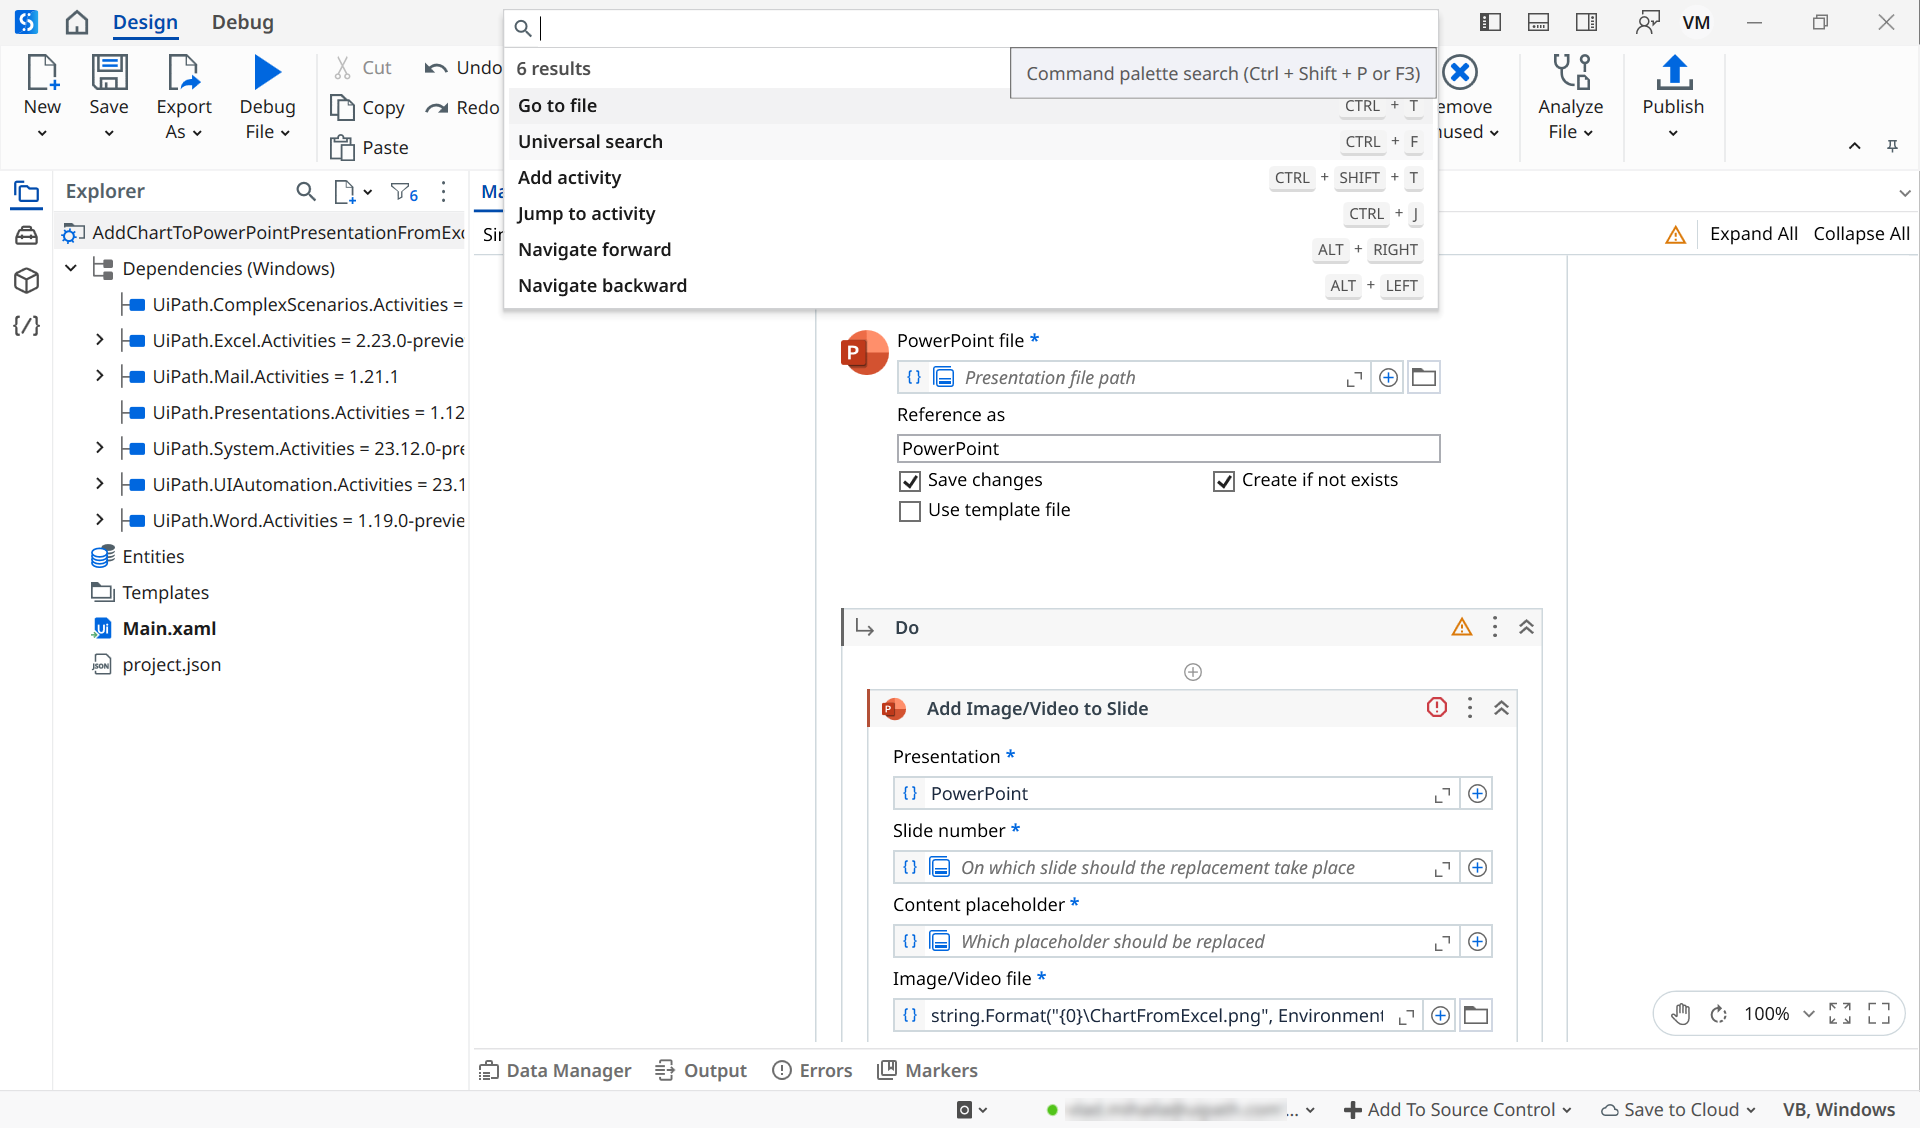
Studio supports prioritizing activities by scope. Click the  icon inside an activity scope and notice that the Command Palette offers suggestions of activities which fit the current scope. Support for this feature is rolling out in stages in official activities packages, check release notes periodically.
Add Activity
The Add activity search bar is opened using the Ctrl + Shift + T keyboard shortcut. You can search for activities in installed and installable packages, and add them after the selected activity in the file. The bar automatically assigns keyboard shortcuts to the first five results, and remembers your previous findings.
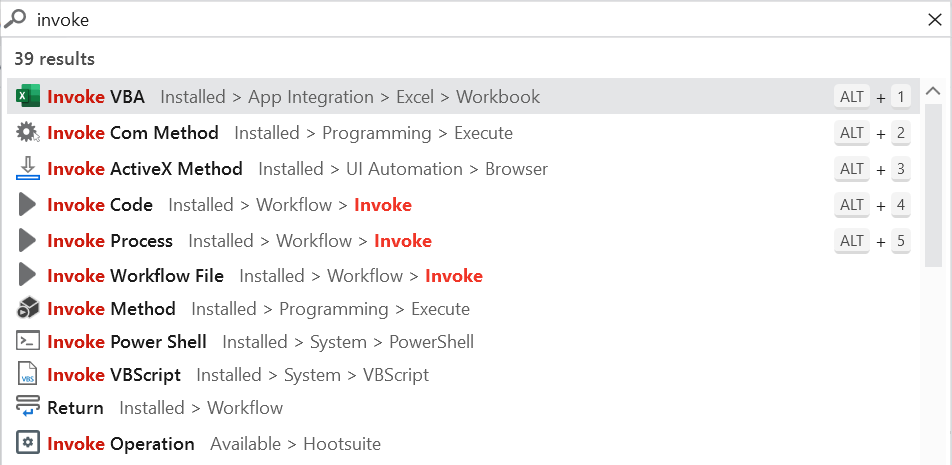
Click the  icon at the top or bottom of an activity from a sequence to open the Add activity search bar.
If the Enable AI activity suggestions option in the Studio design settings is selected, a UiPath AI service analyzes the location in the workflow where you opened the Add activity search bar and suggests activities that you may want to add next based on the current context. If there is no context (for example, you press Ctrl + Shift + T when no activity is selected in the Designer panel) activity suggestions are not provided.
If the Show activities available to install option in the Studio design settings is selected, you can search for activities that are not included in your installed packages. Searching for available activities is only possible for packages from the Official and Orchestrator Tenant feeds. Adding an available activity also installs its corresponding activity package. Selecting the installation  button installs the package without adding the activity to the workflow.
Generate workflows with Autopilot™
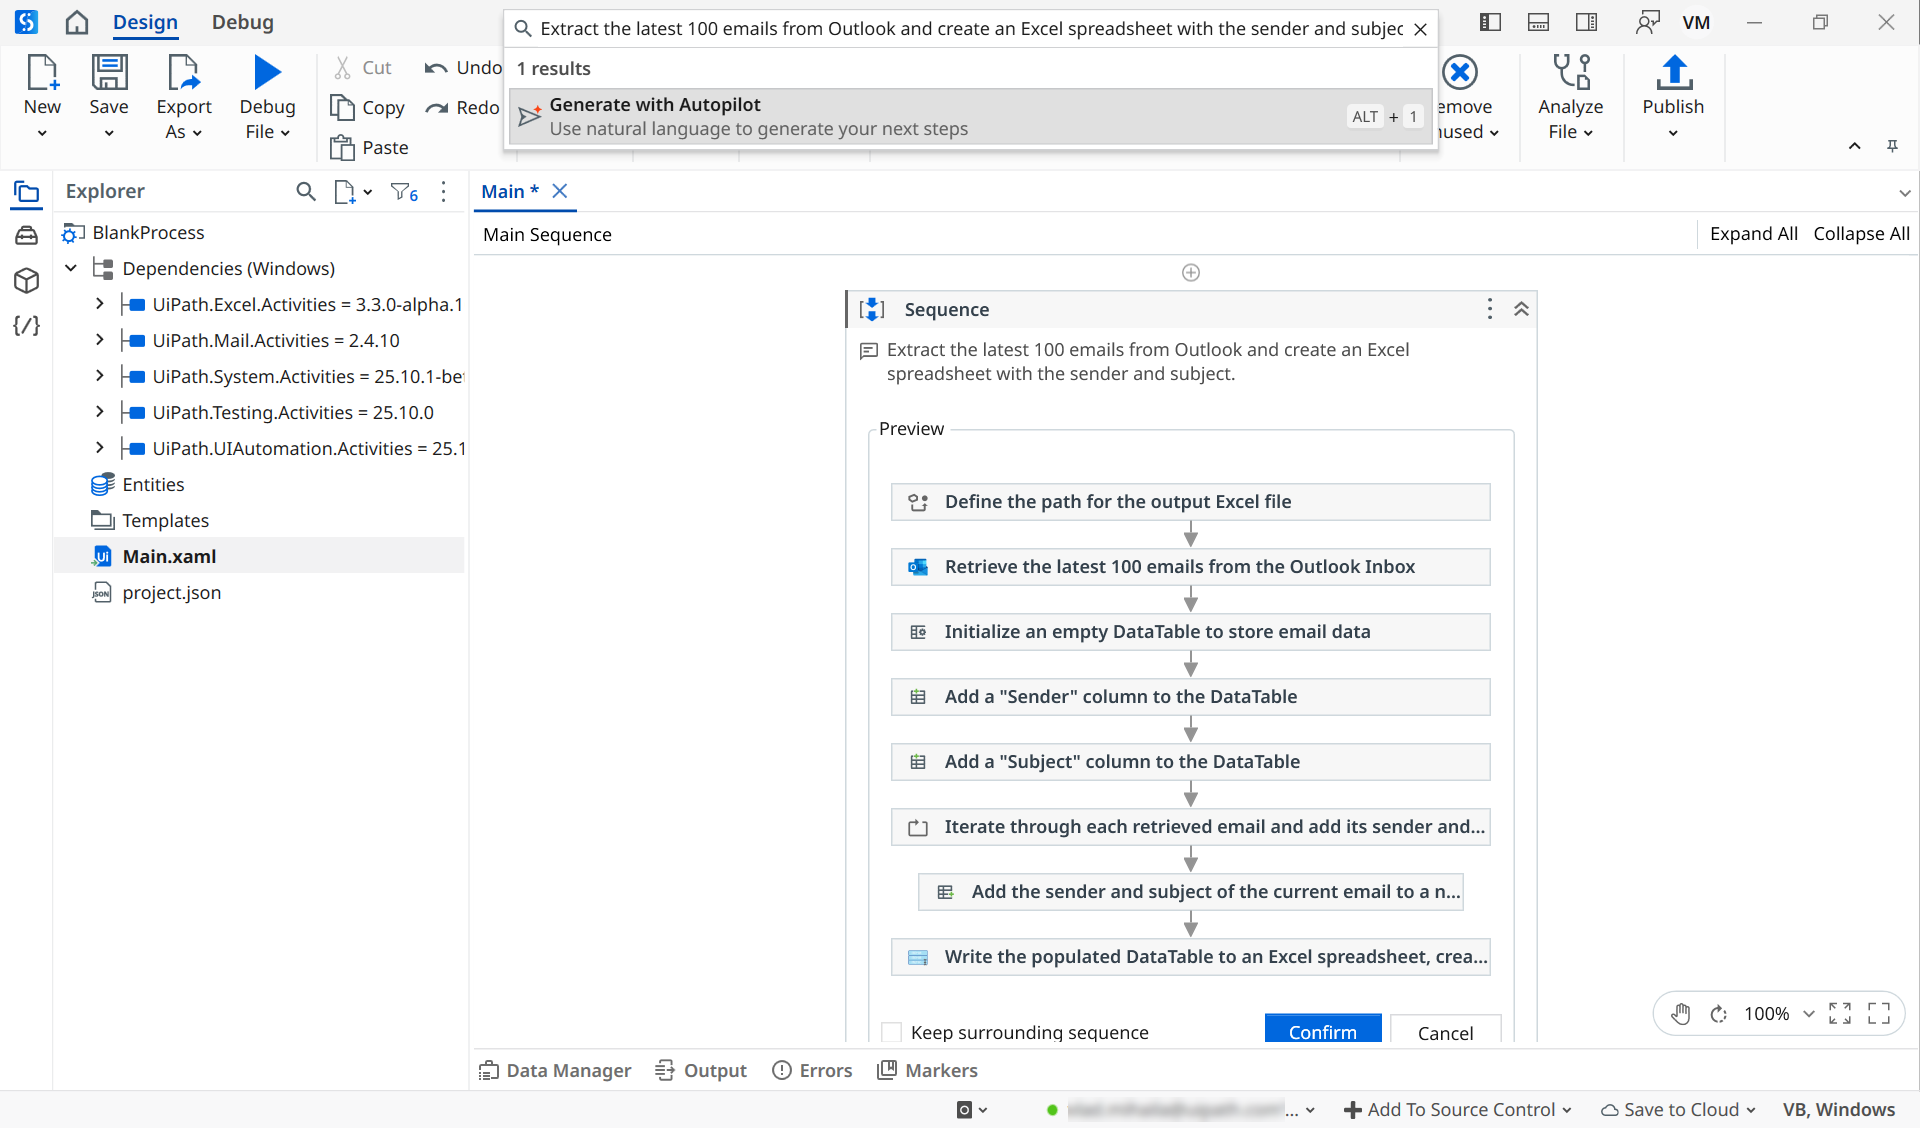
With Autopilot™ generative capabilities, you can use natural language to describe the structure and outcome of a workflow. To automatically generate a workflow, simply type in the search bar what your workflow should do and double-click the Generate with Autopilot option. Autopilot will then analyze your instructions, identify relevant activities, and add them in a logical sequence. If the instructions are not valid, you are asked to try a different description.
After processing your instructions, a preview of the proposed workflow is created inside a new sequence. The preview contains the activities that will be used in your automation. Hovering over an activity reveals the activity package to which it belongs.
Your instructions are also added as an annotation that can be used to edit the proposed workflow. If you are not satisfied with the structure created by Autopilot, you can refine your initial instructions by clicking inside the annotation, editing the description, and selecting the Generate button, which will create a new workflow preview.
After ensuring the workflow works as expected, select the Confirm button to have Autopilot build the workflow. You can also choose to keep the Sequence activity surrounding the resulting workflow by selecting the Keep surrounding sequence option, enabling you to further edit the generated workflow. Otherwise, select the Cancel button to discard the preview.
After the workflow is generated, you can modify your instructions by clicking inside the sequence's annotation. After selecting the Generate button this time, a message window informs you that all the current activities and their configurations will be lost and ask you to confirm the generation. Select OK to proceed with generating a new workflow based on your updated instructions or Cancel to keep the current workflow.
- You can generate workflows from any sequence, including sequences placed inside another workflow.
- An Automation Cloud™ connection is required to access Autopilot functionalities.
- Workflows generated with Autopilot may contain activities that are restricted by Automation Ops policies.
The Universal Search
The Universal search bar enables you to find snippets, activities, variables, arguments, imports, project dependencies, and files in your current project. Searches return results from all workflow files, including files that are closed.

| Option | Shortcut | Description |
|---|---|---|
| Current File | Ctrl + 1 | Lists results from the currently opened file that match the search query. |
| All Files | Ctrl + 2 | Lists results found in all files part of the current project that match the search query. |
| Activities | Ctrl + 3 | Lists results from activities that match the search query. |
| Variables | Ctrl + 4 | Finds variables in the current project that match the search query. |
| Arguments | Ctrl + 5 | Finds arguments defined in the project that match the search query. |
| Imports | Ctrl + 6 | Finds imported namespaces in the project that match the search query. |
| Project Files | Ctrl + 7 | Finds files part of the current project that match the search query. |
| Dependencies | Ctrl + 8 | Lists results found in dependencies installed to the project. |
| Snippets | Ctrl + 9 | Finds snippet files that match the search query. |
Search results persist until the next time you open the search bar if you use Universal search or Add activity. For Go to file and Jump to activity the previous search query is not persisted.
Double-click an activity or press Enter to add it to the currently opened file. Using the same commands, you can open files from under the All Files or Project Files category, or focus on the desired search result.
Default values of arguments from a process inside the Invoke Workflow activity are not searchable with the Universal Search.
Go to File
The Go to file bar searches and opens files part of the current project folder. .xaml files are opened in the Designer panel in Studio, while other files, such as screenshots or Excel files, are opened with their respective default application on your machine. Double-click or press Enter to open a file.

The Activities panel, Explorer panel, and the Command Palette support fuzzy search, which means that a list of results is returned even if the search terms don't match exactly. The search terms could be slightly incomplete, misspelled or include only the first letter of each word. For example, if you type dci in the Activities bar, it returns the Double Click Image activity.
Jump to Activity
The Jump to activity search bar part of Command Palette helps find and focus specific activities in large workflows. It is accessed by using the Ctrl + J keyboard shortcut, or by opening using the F3 or Ctrl + Shift + P shortcuts, and selecting Jump to activity.
When opened, the Jump to activity bar displays the list of all activities in the .xaml file currently focused in the Designer panel.
Type the display name or the namespace of an activity, for example Assign. Use the keyboard arrows to select the activity and press Enter to focus it in the Designer panel.
Activities in the Jump to activity bar are arranged in the following order: container, parent, and child activities.

Navigate forward and Navigate backward
The Navigate forward and Navigate backward navigation options allow you to:
- Go to the previous element inside a project file or to the previous project file or
- Go to the next element inside a project file or to the next project file.
The Panels
The Designer Panel
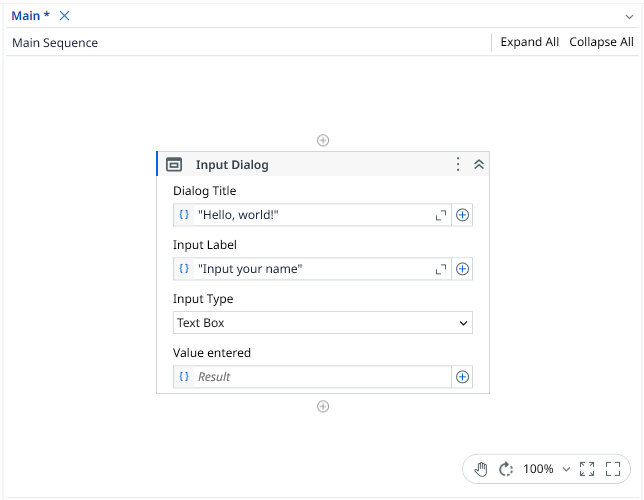
The Designer panel displays your current automation project, enables you to make changes to it, and provides quick access to variables, arguments and imports.
It is possible to navigate within a diagram by double-clicking the activity you want to view. The path is displayed as breadcrumbs in the header of the Designer panel. Please note that when using multiple displays scaled differently the text in the input field part of some activities might be improperly shown.
Activities can be copied using Ctrl + C shortcut or the context menu, to a text editor, receive changes, and then copied back to the Designer panel. You can undo / redo an action you performed in the panel using the buttons in the Studio ribbon or by pressing Ctrl + Z / Ctrl + Y.
If an activity has validation errors, an error icon ![]() is displayed on the right side of the activity title bar in the Designer panel and a warning icon
is displayed on the right side of the activity title bar in the Designer panel and a warning icon ![]() is displayed for all its parent activities. The error message is also displayed at the top of the Properties panel for the activity affected by the issue and can be copied by selecting the clipboard icon next to the message.
is displayed for all its parent activities. The error message is also displayed at the top of the Properties panel for the activity affected by the issue and can be copied by selecting the clipboard icon next to the message.
Activate Pan Mode by clicking the  icon, holding the Space key or pressing the middle mouse button. Use the zoom drop-down to change the zoom level and click the
  icon to reset it back to 100%.
The Fit to Screen  icon changes the zoom in such a way that the whole workflow fits in the Designer panel. Click the
  icon to get an overview of the whole project and navigate through sections by adjusting the focus.
To edit property values faster, activate Compact Mode from Settings > Design > Design Style > Compact Design Experience and open the Expression Editor from the primary property, which is displayed in the title of an activity. Select the expander in the left-hand corner of the pill. For properties that do not use the Expression Editor , the Properties panel is opened with a focus on the referenced property.
Activity and sequence summarization with Autopilot™
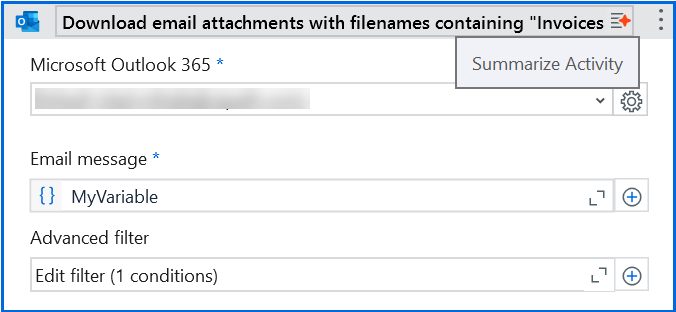
Using Autopilot™ summarization capabilities, you can create meaningful names which clearly describe what an activity or a sequence is doing. This feature is particularly useful for improving the readability of large workflows, which can be hard to review or maintain.
To improve the clarity and consistency of activity names, Autopilot takes into account the elements that define the activity, including its description, arguments, properties, input values, and its corresponding package name and description. In the case of sequences, Autopilot creates a single-sentence summary from all the descriptions of the activities included in the sequence.
To use this feature, double-click the name of an activity or a sequence in the title bar (or select Rename from the activity or sequence context menu ), and then click the Summarize Activity button. Autopilot will then generate a unique name which describes what the activity or sequence does.
The Context Menu

The context menu enables you to perform several operations on your workflow, be it a sequence, flowchart, state machine, or long running workflow. You can display it by right-clicking an activity inside your workflow.
If you select more activities, the menu is not displayed at all.
Field Descriptions for the Context Menu
| Option | Description |
|---|---|
| View Parent | Displays the parent of the target activity in the Designer panel. This option is only displayed for child-activities, if they are opened in the Designer panel. |
| Open | Opens the selected activity in the Designer panel. Has the same result as double-click. |
| Collapse | Collapses the activity thus reducing the displayed details to "Double-click to view". You can achieve the same result by clicking the Collapse button Only displayed for sequences. |
| Expand in Place | Expands the content of the activity, displaying its detailed content. You can achieve the same result by clicking the Expand button Only displayed for sequences. |
| Cut | Removes the selected activity and places it onto the clipboard. |
| Copy | Copies the selected activity and places it onto the clipboard. Activities from read-only files can be copied to another workflow or a .txt file. When copying multiple activities to the clipboard, their order is reversed. :warning: Copying an activity to a project with a different compatibility (e.g. from Windows - Legacy to cross-platform) can cause the execution of the destination workflow to fail. |
| Paste | Inserts the content of the Clipboard at the current location. |
| Delete | Deletes the target activity. Note: Since the Context menu is only displayed for a one-activity selection, you can use this command for more activities with the corresponding keyboard shortcut, Delete. |
| Annotations | Add, edit, delete, show and hide annotations added to activities in the workflow. |
| Export as Image |
|
| Create Variable | Creates a variable in the Variable panel. |
| Auto Arrange | Automatically arranges activities in a flowchart, state machine, or a long running workflow either horizontally or vertically. |
| Import BPMN file | Import existing BPMN files into a long running workflow. Note: Only displayed for long running workflows. |
| Change Type | Replaces a placeholder activity with another activity. Note: Only displayed for long running workflows. |
| Change Color | Changes the color of activities in the Designer panel. Note: Only displayed for long running workflows. |
| Remove Surrounding Sequence | Removes the selected Sequence activity from the Designer panel. The activities that it contains are moved to the parent sequence. |
| Surround with Try Catch (Ctrl + T) | Inserts the activity in a Try Catch statement. A Try Catch statement is used for handling exceptions caused by data or coding errors. The Try clause encloses the activity to be checked for exceptions. The Catches clause is the exception handler. The Finally clause is used for executing an activity regardless of the status of the first two clauses. |
| Extract as Workflow | Creates a new workflow containing the targeted activity with the purpose of breaking down a large project into smaller ones. In the place of the extracted activity an Invoke |
| Enable Activity | Enables a previously disabled activity. |
| Disable Activity | Disables an activity, which is then placed inside a Comment out activity. |
| Toggle Breakpoint | Marks the selected activity as a breakpoint for debugging. Breakpoints can also be toggled by clicking the Breakpoint button in the Execute tab. You can trigger a breakpoint for one activity at a time. |
| Toggle Bookmark | Places a bookmark on the selected activity or removes a bookmark placed on the activity. |
| Edit Breakpoint Settings | Opens the Breakpoint Settings window. |
| Debug |
|
| Show All Conditions | Displays all conditions defined in your project ( Properties panel > Conditions ). Note: This option is only displayed for flowcharts when you right-click an empty space inside the project; it is not displayed if you right-click an activity in your flowchart. |
| Hide All Conditions | Hides all displayed conditions. Note: This option is only displayed for flowcharts when you right-click an empty space inside the project; it is not displayed if you right-click an activity in your flowchart. |
| Set as Start Node | Connects the selected activity with the Start node. Only displayed for flowcharts. |
| Set as Initial State | Connects the State Machine specific activity with the Start node. Only displayed for state machines. |
The context menu is also displayed for tabs in the Designer panel. The following options are available:
| Option | Description |
|---|---|
| Close | Closes the active tab. |
| Close Others | Closes all tabs but the active one. |
| Close All Documents | Closes all tabs. |
| Float | Undocks the target tab and changes it to a floating state. |
| Pin Tab | Pins the target tab in the Designer panel. The tab pinned last is always moved in front of all other existing tabs (pinned or not). The position of a pinned tab can only be changed relative to other pinned tabs. |
| New Horizontal Tab Group | Splits the screen horizontally, enabling you to see two or more instances of the Designer panel within the same screen. The target project is moved onto the panel on the right. Only displayed when your project contains two or more tabs and, implicitly, workflows. |
| New Vertical Tab Group | Splits the screen vertically, enabling you to see two or more instances of the Designer panel within the same screen. The target project is moved onto the panel at the bottom. Only displayed when your project contains two or more tabs and, implicitly, workflows. |
| Move to Previous Tab Group | Moves the target tab onto the previous Designer panel displayed. Only displayed if you had used the New Vertical Tab Group or New Horizontal Tab Group options before. |
| Move to Next Tab Group | Moves the target tab onto the next Designer panel displayed. Only displayed if you had used the New Vertical Tab Group or New Horizontal Tab Group options before. |
The Explorer Panel
The Explorer panel enables you to manage project files, dependencies, and configure project settings. For more information, see Managing Projects.
The Data Manager Panel
The Data Manager panel enables you to manage data such as variables, arguments, constants, namespaces, and connections from a centralized location. For more information, see Using the Data Manager.
The Activities Panel
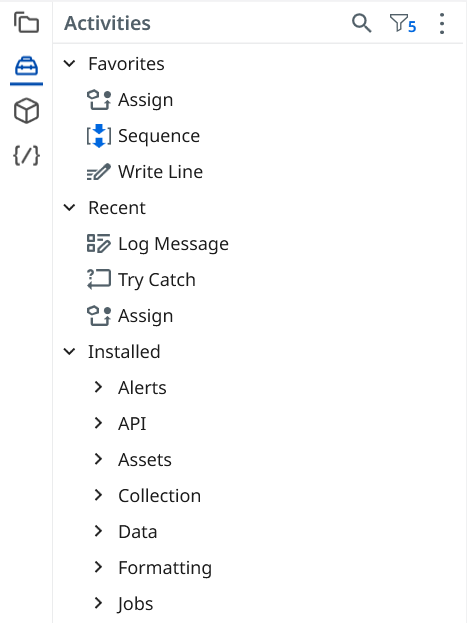
The Activities panel shows activities that can be added to the current workflow. In Windows and cross-platform projects, you can see both installed and available activities, while in Windows - Legacy projects only installed activities are visible. Installed refers to activities from packages that are already added as project dependencies, while available refers to activities from packages that are not installed, but are available for installation from the Official and Orchestrator Tenant feeds.
You can search for activities by name and optionally by description using the search box at the top of the panel, navigate through them using navigation keys, and press Enter to add the selected activity to the currently opened file.
The search box can be used for finding activities by their class name, regardless of the interface language set in Studio.
Hovering over an activity in the panel displays the package it belongs to and its description. To add an activity to the list of favorites, right-click it and select Add to favorites.
Right-click an activity in the panel and select Create Test Bench to test out one or more activities before adding them to a project. Read more about this here.
Adding Available Activities
In Windows and cross-platform projects, you can quickly find and add activities from official UiPath packages that are not installed in your projects using the Available category in the Activities panel and the Add activity search bar.
To add an available activity to your project, double-click it or drag and drop it in your workflow. When you add an available activity to a project, the package that contains it is installed as a project dependency. You can also add an available package to your project by right-clicking its name and selecting Install.
Adding Integration Service Activities
Most Integration Service activities can be added only from the Available category. The activities are included in a single package, UiPath Integration Service Activities, enabling you to quickly add multiple activities for different connectors. The activities in this package are not displayed in the Installed section of the Activities panel.
When an update is available for an activity that is already added to a project, it is automatically updated whenever you add a new Integration Service activity or reopen a project.
To add Integration Service activities to a project:
- Add an available Integration Service activity, or right click the name of the category in the Available section and select Install to add the UiPath Integration Service Activities package as a project dependency.
- Add other Integration Service activities from the Available category, without installing additional packages. The available activities included in the Integration Service package are added to your workflow instantly.
For more information about working with Integration Service activities, see the Integration Service activities guide.
Integration Service activities are not available in the Available section when Studio is accessed through an Orchestrator troubleshooting session. To work with Integration Service activities, open Studio with your standard user account outside of a troubleshooting session.
Customizing the Activities Panel
Select the Search  button at the top of the panel to search for activities.
Select the More actions  button to access additional options:
- Expand All: Expands all activity categories.
- Collapse All: Collapses all activity categories.
- Search by description: Enables you to search for keywords in the activities' descriptions.
- Group by category: Groups available activities by the category they belong to.
- Group by package: Groups available activities by the package they belong to.
Note:
You can clear the last two options to see an ungrouped list of activities arranged alphabetically.
Select the Filter by  button to filter activities based on the options below.
For cross-platform projects
- Filter by availability:
- Installed - Show activities that are part of packages installed in your project (this filter cannot be deactivated)
- Available - Show activities that are part of uninstalled packages that you can add to you project
- Windows - Show activities that are only available in Windows projects
- Filter by type:
- Activities - Show activities
- Triggers - Show triggers
- Filter by category:
- Preview - Show prerelease activities (this setting can be governed)
For Windows projects
- Filter by availability:
- Installed - Show activities that are part of packages installed in your project (this filter cannot be deactivated)
- Available - Show activities that are part of uninstalled packages that you can add to you project
- Filter by type:
- Activities - Show activities
- Triggers - Show triggers
- Filter by category:
- Preview - Show prerelease activities (this setting can be governed)
For Windows - Legacy projects
- Filter by type:
- Activities - Show activities
- Triggers - Show triggers
- Filter by category:
- Preview - Show prerelease activities (this setting can be governed)
The Components Panel
The Components panel is a contextual panel that appears when you create or open a form in Studio. The panel contains UI components that you can drag and drop into the Designer panel to build custom forms. For more information, see Form components.
The Snippets Panel
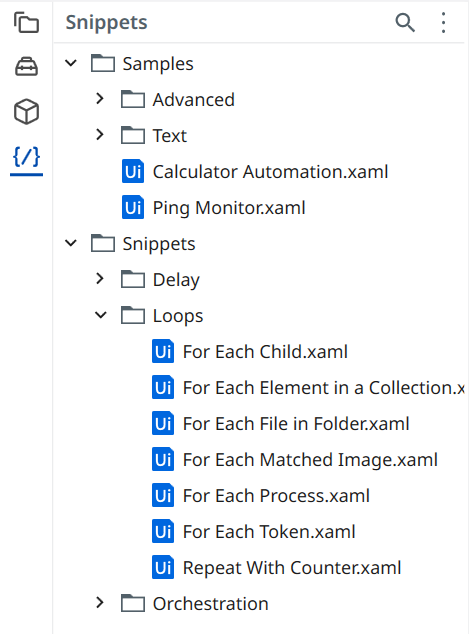
The Snippets panel enables you to easily reuse automations. It includes, by default, multiple samples and snippets.
You can search for snippets and select the More actions  button for additional options:
- Expand All: Expands all snippet categories.
- Collapse All: Collapses all snippet categories.
- Refresh: Reloads the panel to its default settings.
- Add folder - Allows you to add your own snippets by selecting a directory from your hard drive. Empty folders are not displayed.
To remove a folder, right-click it and select Remove.
The Source Control Panel
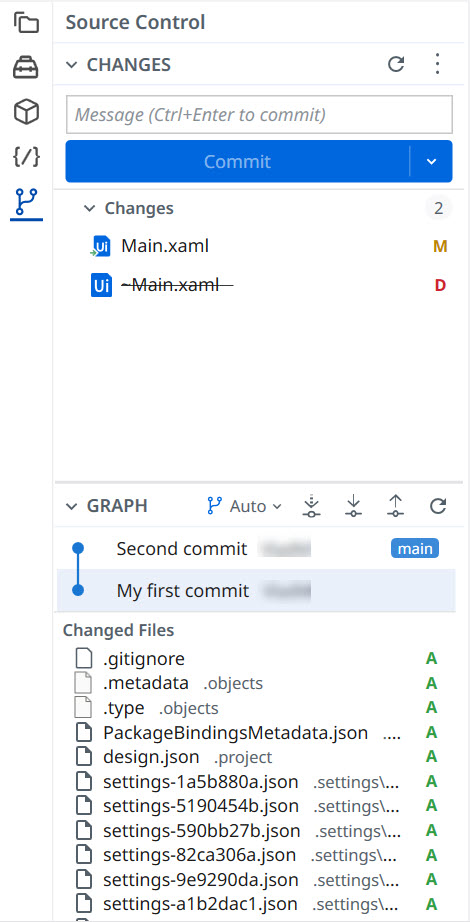
The Source Control panel provides a complete Git workflow directly in Studio. The panel is available whenever a project that belongs to a Git repository is open. The panel is divided into two section:
- The Changes section lists all files that have been modified, added, deleted, or renamed in the working tree, and hosts the commit controls.
- The Graph section displays the repository's commit history as an interactive visual graph.
To learn more, refer to the The Source Control Panel.
The Properties Panel

The Properties panel is contextual and enables you to view and change the properties of a selected activity. When selecting two activities in the same workflow, common properties can be modified from the Properties panel.
In projects with the cross-platform compatibility, all activity properties are available in the activity card in the Designer panel if the Show activity properties inline design setting is enabled. This also applies to some activities in projects using the Windows compatibility.
The Expression Editor
The Expression Editor is accessible with the Ctrl + Shift + E keyboard shortcut when used inside activity input fields. It is also available from the Properties panel, from fields that require inputting text, and from the body of an activity, by adding text directly in the required fields.

The Expression Editor includes intelligent code completion features. Expressions can be written on multiples lines. Keyboard shortcuts for creating variables and arguments directly in expressions are available.
Use Ctrl + F inside the editor to open the search and replace capabilities. Select part of an expression and press Ctrl + F3 to add the text to the search field. Hold the Ctrl key to make the search pane semi-transparent and see the text behind it.
When you close the editor, its position on the display, window size, and text zoom level are saved and applied the next time you open it.
To edit property values faster, activate Compact Mode from Settings > Design > Design Style > Compact Design Experience and open the Expression Editor from the primary property, which is displayed in the title of an activity. Select the expander in the left-hand corner of the pill. For properties that do not use the Expression Editor , the Properties panel is opened with a focus on the referenced property.
The Autopilot Panel
The Autopilot panel is a centralized AI-powered interface that simplifies the development and maintenance of your automation projects.
Autopilot is a conversational interface designed to help you interact with UiPath products. It offers you a persistent, context-aware workspace where you can build automations, explore product features, or search documentation using natural language.
Autopilot maintains input history, interprets intent, and responds with relevant, task-specific suggestions. You can reference earlier inputs, adjust parameters, refine prompts, and clarify intent at any point in the workflow. You can ask Autopilot to explain a suggestion, rephrase an instruction, or modify an existing step, all from within the same interface.
Autopilot evolves at the same time with your automation logic, ensuring relevant recommendations as requirements change.
Here are the main capabilities of Autopilot:
- Context retention—remembers previous inputs and decisions.
- Prompt refinement—lets you edit your prompt in real-time to improve outcomes without starting from scratch.
- Conversational experience—uses natural language to ask questions and make changes.
- Inline suggestions—offers recommendations directly in the chat, specific to your current context.
- Unified workspace—keeps all interactions, iterations, and results in one place.
- Workflow continuity—maintains the flow across steps and stages.
- Interactive debugging—helps you identify and fix issues by asking follow-up questions or clarifying intent.
- Code and logic awareness—understands the structure of your automation or code and provides relevant guidance.
Autopilot can use various Large Language Models (LLMs) to power its capabilities. The choice of LLM influences performance, reasoning depth, and speed.
The Chat Screen is the main screen of Autopilot, where all your interactions reside. To access the Autopilot chat screen, look for the Autopilot  icon in Studio.
On the chat screen you can perform the following actions:
- Use the chat box to interact with Autopilot by providing prompts or asking questions
- Use the dynamic prompt suggestions, which change alongside your workflow context.
- Select the language model Autopilot uses in your interaction. You can select from the available Gemini or GPT-5 instantiations, based on your needs.
- Upload files for future handling and exploration.
- Open a New chat
 , access the Settings
  menu, or the Chat History
 .
.
The New Chat option in the Autopilot header starts a fresh conversation and saves the previous one in your chat history. Use it when you want to switch topics, so your old prompts and answers do not affect the new interaction.
The Settings options opens the Settings menu, where you can control how Autopilot behaves. You can personalize its responses, enable specific tools, or connect it to Orchestrator MCP Servers.
The available settings are:
- Personalization—This section focuses on customizing the chat interaction style and specific instructions:
- Show Follow Ups—On by default, so Autopilot displays follow-up questions or actions after a response to help continue the conversation. Turn it off for a cleaner interaction.
- Custom Instructions—A free-text field where you can write specific guidance or preferences for how Autopilot should respond. For example, preferred terminology, level of technical detail, or specific frameworks/tools you use often. A character counter (0/300) indicates the length limit for these instructions.
- MCP Servers—This section focuses on configuring and managing MCP servers that Autopilot can connect to, so it can generate context-aware suggestions based on structured, task-specific information.
- Enter server URL—A text field to input the URL of an MCP server, then Add it.
- Current Servers—The list the MCP servers already configured and available to Autopilot.
- Manage—Provides access to the MCP Servers configuration page in Orchestrator.
Important:
Only MCP servers created in Orchestrator are supported.
- Tools—The list of the capabilities and tools available to Autopilot, organized under Framework Tools. You can manage and configure each tool, depending on the context you use Autopilot in.
- Save and Reset to Defaults options
- **Save—**Applies your current settings.
- **Reset to Defaults—**Reverts all settings to their original state.
- Download conversation—Allows you to download the current conversation to your local device in JSON format. The file includes details about the organization, tenant, and specific conversation settings.
The Chat History option allows you to view and reopen past conversations with Autopilot from the last 30 days. It provides a searchable list of previous interactions. Select an entry to return to useful suggestions, troubleshooting steps, or workflow drafts. You can continue the conversation within that session and benefit from its existing context.
The Autopilot panel improves error handling and troubleshooting by providing AI-based suggestions for resolving workflow errors. Autopilot gives you detailed explanations for each error, as well as clear, context-aware recommendations that you can then apply to your workflow. These advanced capabilities also work with Workflow Analyzer errors.
To learn more, refer to the Autopilot user guide.

The Terminal Panel
The Terminal panel allows you to use a fully-featured command line interface directly in Studio. The terminal starts in the current project folder and is fully compatible with Claude Code and any other CLI tool you are familiar with, allowing you to interact with these tools without leaving your project. Changes made to project files through the Terminal panel are reflected instantly in the project.
The Outline Panel
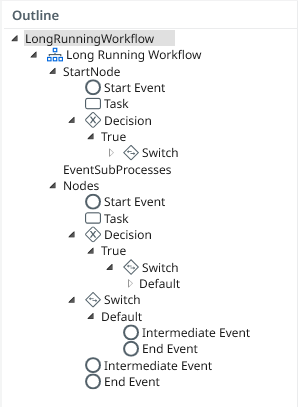
The Outline panel displays the project hierarchy, and all available nodes. You can highlight activities in this panel by selecting them in the Designer panel, or you can go to a specific activity by selecting it in the Outline panel.
The Output Panel
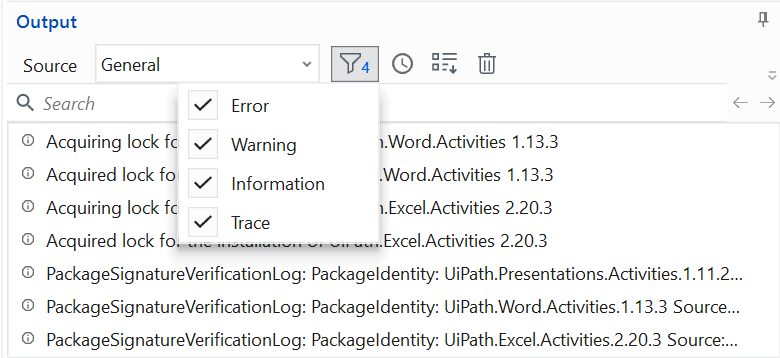
The Output panel enables you to display the output of the Log Message or Write Line activities, among other things. Exceptions for packages are also displayed in this panel.
From the Output panel, you can show or hide messages that have different log levels (errors, warnings, information, and traces) by selecting the filter button in the panel’s header. Double-clicking a message displays further details about it, with the option to copy information. You can also copy information by right-clicking a message and selecting Copy.
From the Source drop-down menu, you can filter sources that generated the logs (General, Debug, Compile, Tests). The last log pertaining to each source is preserved. The source dynamically changes to reflect the actions that are taking place.
When searching for a log in the Output panel and selecting an item from the search results list, the log is highlighted. Searching is done at source level.
The Export Logs button is used for exporting logs into a .txt file. It exports timestamps and error message details as well. Exporting filtered logs is available. For example, if you want to export only trace level logs, filter the list and then use the Export Logs button.
When debugging, the Output panel shows logs for when an activity starts executing and until it ends. This can be enabled from the Log Activities option in the Debug tab.
The Errors panel displays errors found in the file or project during the validation process, together with errors generated by Workflow Analyzer rules.
The Clear All button erases all info displayed in the Output panel. Logs and other data stored in this panel are erased when a workflow is run. The Output panel displays up to 2,000 lines at a time.
The Show timestamps button shows or hides the timestamps corresponding to each log.
The Output panel is not intended for production monitoring and should only be used when developing automations. Events might not be displayed as expected if, for example, a large number of Log Message activities are used. To monitor production runs, use the Orchestrator logs.
The Find References Panel
The Find References panel displays results for references you search for in your project. To find every place in the project where an element is referenced, right-click it and select Find References. This works for the following:
-
Files in the Explorer panel
-
Activities in the Activities panel
-
Variables in the Variables and Data Manager panels
-
Arguments in the Arguments and Data Manager panels
-
Descriptors in the Object Repository panel

Debugging Panels
The following panels are available to help you debug your projects: Markers, Call Stack, Locals, Watch, and Immediate.
The Status Bar
In the status bar, you can view status information and access options related to Orchestrator and source control:
-
Orchestrator/Cloud Connection - Select
 to access Orchestrator options: sign in to your cloud account, disconnect from Orchestrator (if connected with a machine key), and refresh resources.
 -
Orchestrator Status - Displays the Orchestrator connection status. When connected to Orchestrator, the currently selected folder is displayed. You can click the name of the current folder to view a list of available folders and select another folder from which to sync resources.
-
Source Control - Depending on whether the project is connected to a source control repository, different options are available to help you manage source control integration. For more information, see About Version Control.
-
Cloud Project - A menu is available with options related to editing the project in Studio Web. If a project is not already synced with Studio Web, the label Cloud Compatible is displayed. If the project is already synced with Studio Web, the label Cloud Project is displayed. For more information, see Designing Cross-platform Projects.
-
Project Language - Displays the language used for expressions in the project, VB or C#.
-
Project Compatibility - Displays the compatibility of the project: Windows - Legacy, Windows or cross-platform.

- Overview
- The Ribbon
- Ribbon Display Options
- Ribbon Tabs
- The Title Bar
- Backstage View
- The Command Palette
- Add Activity
- The Universal Search
- Go to File
- Jump to Activity
- Navigate forward and Navigate backward
- The Panels
- The Designer Panel
- The Explorer Panel
- The Data Manager Panel
- The Activities Panel
- The Components Panel
- The Snippets Panel
- The Source Control Panel
- The Properties Panel
- The Autopilot Panel
- The Terminal Panel
- The Outline Panel
- The Output Panel
- The Find References Panel
- Debugging Panels
- The Status Bar
 .
.  .
.