- Getting Started
- Setup and Configuration
- Automation Projects
- Dependencies
- Types of Workflows
- Control Flow
- File Comparison
- Automation Best Practices
- Source Control Integration
- Debugging
- Logging
- The Diagnostic Tool
- About The Diagnostic Tool
- Workflow Analyzer
- About Workflow Analyzer
- ST-NMG-001 - Variables Naming Convention
- ST-NMG-002 - Arguments Naming Convention
- ST-NMG-004 - Display Name Duplication
- ST-NMG-005 - Variable Overrides Variable
- ST-NMG-006 - Variable Overrides Argument
- ST-NMG-008 - Variable Length Exceeded
- ST-NMG-009 - Prefix Datatable Variables
- ST-NMG-011 - Prefix Datatable Arguments
- ST-NMG-012 - Argument Default Values
- ST-NMG-016 - Argument Length Exceeded
- ST-NMG-017 - Class name matches default namespace
- ST-DBP-002 - High Arguments Count
- ST-DBP-003 - Empty Catch Block
- ST-DBP-007 - Multiple Flowchart Layers
- ST-DPB-010 - Multiple instances of [Workflow] or [Test Case]
- ST-DBP-020 - Undefined Output Properties
- ST-DBP-021 - Hardcoded Timeout
- ST-DBP-023 - Empty Workflow
- ST-DBP-024 - Persistence Activity Check
- ST-DBP-025 - Variables Serialization Prerequisite
- ST-DBP-027 - Persistence Best Practice
- ST-DBP-028 - Arguments Serialization Prerequisite
- ST-USG-005 - Hardcoded Activity Properties
- ST-USG-009 - Unused Variables
- ST-USG-010 - Unused Dependencies
- ST-USG-014 - Package Restrictions
- ST-USG-017 - Invalid parameter modifier
- ST-USG-020 - Minimum Log Messages
- ST-USG-024 - Unused Saved for Later
- ST-USG-025 - Saved Value Misuse
- ST-USG-026 - Activity Restrictions
- ST-USG-027 - Required Packages
- ST-USG-028 - Restrict Invoke File Templates
- ST-USG-032 - Required Tags
- ST-USG-034 - Automation Hub URL
- Variables
- Arguments
- Imported Namespaces
- Coded automations
- Introduction
- Registering custom services
- Before and After contexts
- Generating code
- Generating coded test case from manual test cases
- Troubleshooting
- Trigger-based Attended Automation
- Object Repository
- The ScreenScrapeJavaSupport Tool
- Extensions
- About extensions
- SetupExtensions tool
- UiPathRemoteRuntime.exe is not running in the remote session
- UiPath Remote Runtime blocks Citrix session from being closed
- UiPath Remote Runtime causes memory leak
- UiPath.UIAutomation.Activities package and UiPath Remote Runtime versions mismatch
- The required UiPath extension is not installed on the remote machine
- Screen resolution settings
- Group Policies
- Cannot communicate with the browser
- Chrome extension is removed automatically
- The extension may have been corrupted
- Check if the extension for Chrome is installed and enabled
- Check if ChromeNativeMessaging.exe is running
- Check if ComSpec variable is defined correctly
- Enable access to file URLs and Incognito mode
- Multiple browser profiles
- Group Policy conflict
- Known issues specific to MV3 extensions
- List of extensions for Chrome
- Chrome Extension on Mac
- Group Policies
- Cannot communicate with the browser
- Edge extension is removed automatically
- The extension may have been corrupted
- Check if the Extension for Microsoft Edge is installed and enabled
- Check if ChromeNativeMessaging.exe is running
- Check if ComSpec variable is defined correctly
- Enable access to file URLs and InPrivate mode
- Multiple browser profiles
- Group Policy conflict
- Known issues specific to MV3 extensions
- List of extensions for Edge
- Extension for Safari
- Extension for VMware Horizon
- Extension for Amazon WorkSpaces
- SAP Solution Manager plugin
- Excel Add-in
- Studio testing
- Troubleshooting
- About troubleshooting
- Assembly compilation errors
- Microsoft App-V support and limitations
- Internet Explorer X64 troubleshooting
- Microsoft Office issues
- Identifying UI elements in PDF with Accessibility options
- Repairing Active Accessibility support
- Validation of large Windows-legacy projects takes longer than expected
Studio user guide
The UiPath Diagnostic Tool is a standalone utility, enabling you to better collect and preview diagnostics info, which is then packaged and can be sent to our technical support team to help you solve potential problems.
It comes bundled with a variety of collectors to help you gather just the information you need. Moreover, you can save selected collectors as a profile to be used later on. Information can be collected from Studio, Robot, RobotJS, Activities, and Orchestrator.
You can download the Diagnostic Tool from the Resource Center in your Automation Cloud instance.
It also comes installed with Studio, and you can find it in the C:\Program Files\UiPath\Studio folder (for per-machine installations) or in the %localappdata%\Programs\UiPath\Studio folder (for per-user installations).
To access it, simply click the Start button, and search for the Diagnostics Tool application.
The Start Section
The Diagnostic Tool is based on profiles, which gather information using collectors. A profile is a set of collectors specialized in gathering specific information, depending on the issues you have. The tool comes with a couple of predefined profiles, each with a specific set of collectors, but it is also possible to create your own profiles, each suited for a particular issue. Even if you start of with a predefined profile, you can later on add or remove collectors, depending on what information needs to be gathered.
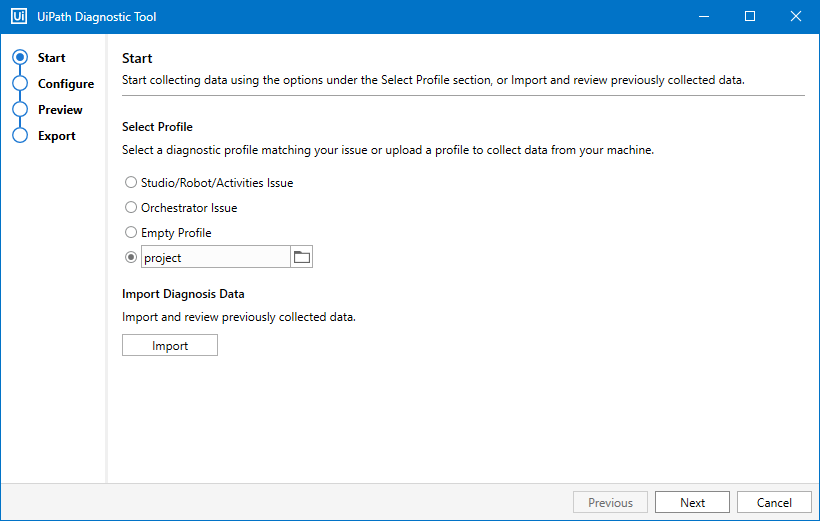
| Profile | Description |
|---|---|
| Studio/Robot/Activities Issue | Gathers information about Studio, Robot, or Activities. This profile comes with several collectors enabled by default. |
| Orchestrator Issue | Gathers information about your connection to Orchestrator. This profile comes with several collectors enabled by default. |
| Empty Profile | This profile does not come with any selected collectors. Here is where you can create custom profiles with the desired collectors to use later on. |
| Custom Location | Gathers info based on a .json file you provide. You can select the collectors to be used. |
Additionally, you can choose to import a previously generated .zip package of collected data to review.
The Configure Section
This section is where all the collectors are found. The first two profiles already have several collectors added, but you can also add others or remove existing ones. Available collectors are as follows:
| Collector | Gathered Information |
|---|---|
| Registry Info | Registry keys used, as well as the corresponding value name and value data. |
| Screen Info | Display or displays used, as well as type, resolution, DPI, and offset coordinates. |
| Event Logs | Generates an .evtx log file for the selected application. This collector can be used with the following filters: • Event Level • SourcesFilter (list of application sources separated by comma) |
| Environment Variables | System or local environment variables used, based on a configurable clause. |
| Computer Info | Name, domain, operating system, session, administrator, and proxy settings of the machine. |
| Log Files | Execution, Studio, ETL, and combined logs. They can be viewed and exported from each section. |
| Process Info | System processes used. |
| Third Party Installations | Enlists all the third party applications used. |
| UiPath Installs | Enlists all installed UiPath products on that machine, as well as the version, type, and path. |
| License | Displays the license type and status. |
| Settings File | Enlists the available UiPath.settings, UiStudio.settings, UiStudio.v2.settings, and NuGet.config files with the possibility to access them. |
| Orchestrator Web Config | Displays the Web.config file, based on the specified Registry Key location and its value. |
| Orchestrator Application Host File | Displays the applicationhost.config file based on a specified folder. |
| Files | Gets the files from a specified DirectoryPath with a configurable Pattern. |
| Custom Registry | Retrieves Registry keys used, as well as the corresponding value name, and value data from a custom path. |
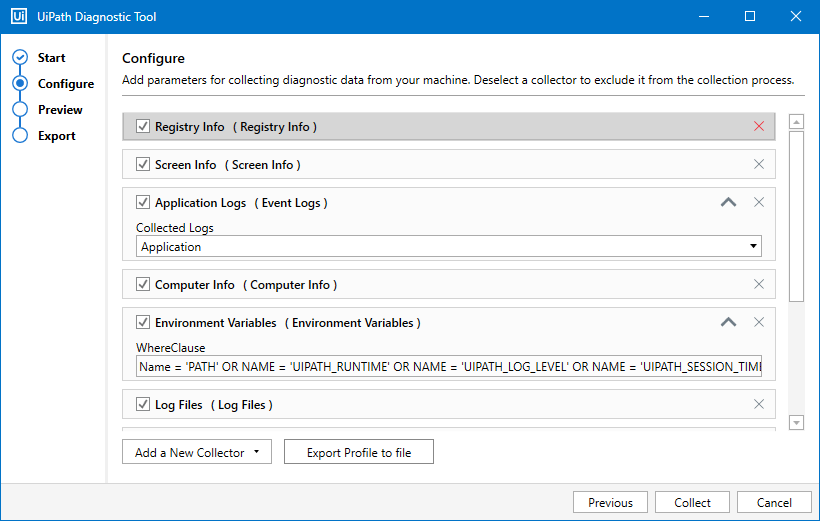
If you're not happy with the provided collectors of a profile, you can simply remove them by clicking the x button in the corresponding collector's container.
If you feel like you need more collectors, click the Add a New Collector button and choose the one you need from the list.
Considering you want to use some collectors multiple times, you can add them to the list and click the Export Profile to File button. This generates a .json file you can later on import from the Start section.
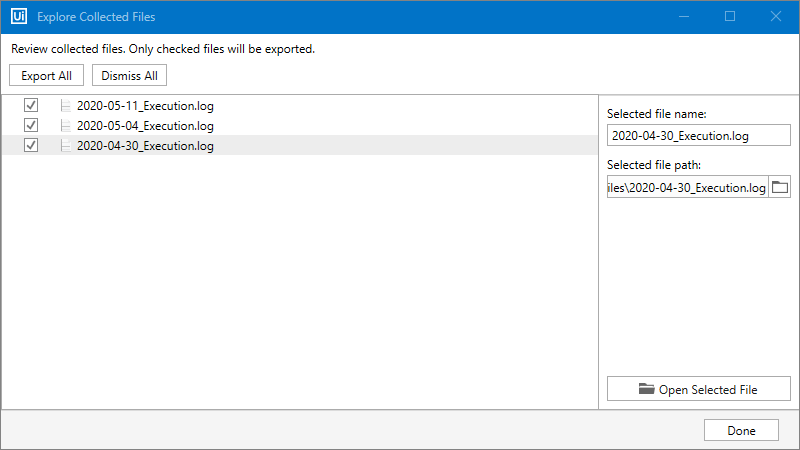
Some collectors allow you to view information in a more detailed manner.
For example, the Log Files collector lets you explore collected files of a log type (ExecutionLogs, StudioLogs, EtlLogs, or CombinedLogs) in a separate window, with the possibility to view a log file's path, open it, or even choose which of the log files to be exported.
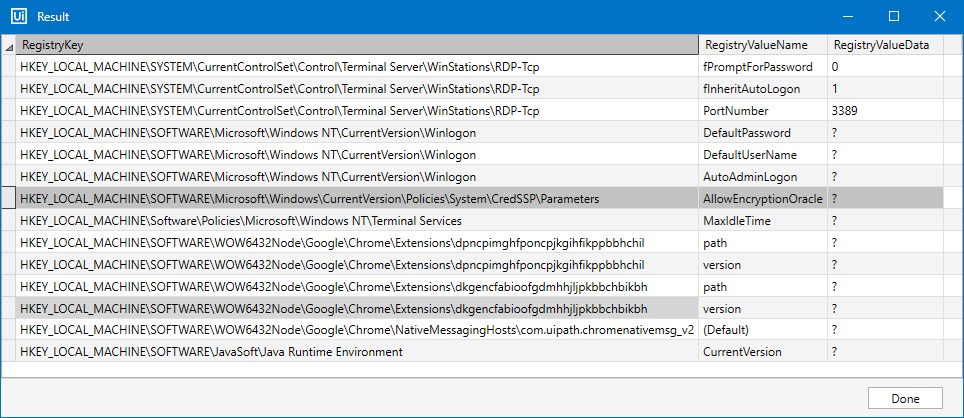
Similarly, the Registry Info collector only displays the first few results in the Preview section, but allows you to view all results in a separate window, by clicking the Displaying x out of y button, where x is the displayed number of results, and y being the total.
The Preview Section
This is where all the collected information is displayed. They are grouped in collapsible boxes to make info easy to read. If you're not happy with particular collectors, you can simply disable them so they don't get exported in the final package.
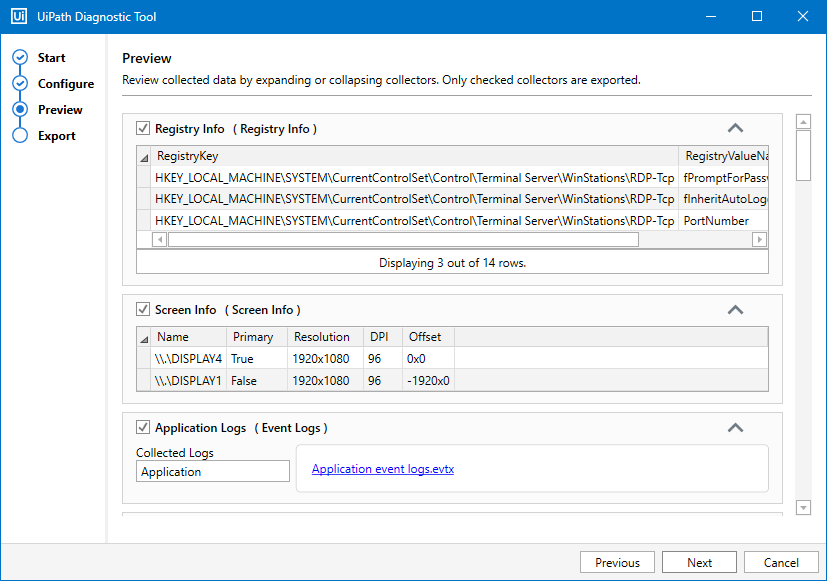
Collectors you don't consider necessary for export can be disabled here. Simply uncheck the desired collectors before clicking Next.
The Export Section
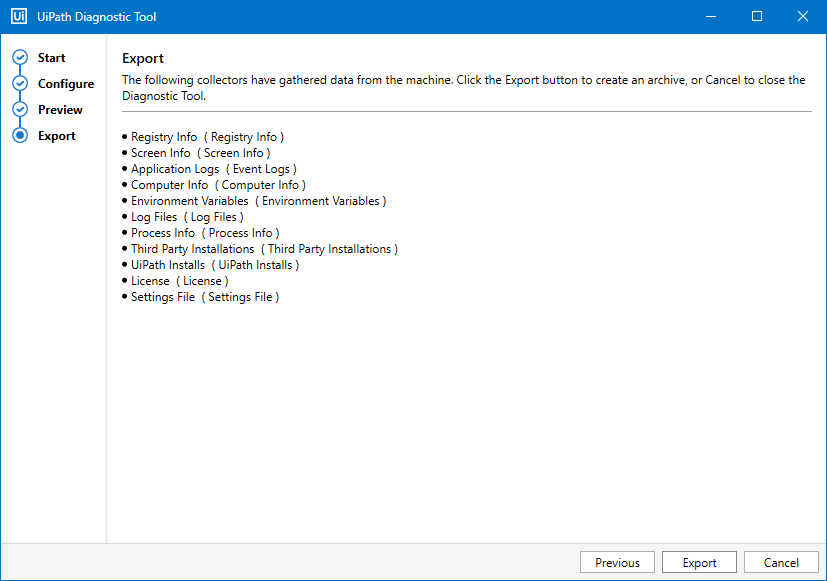
The last section shows a preview of the collectors used in the process. All that's left to do now is to click on Export to save all collected data in a .zip package, with the possibility to open the location where the file is saved. You can also navigate between the sections if you want to make changes to collectors.
Command Line Arguments
The Diagnostic Tool can also be used from the Command Prompt or Windows PowerShell. The arguments and their results are the same, regardless of the usage mode.
It can be accessed as follows:
- Command Prompt - open an elevated Command Prompt instance and use the
cdcommand to the location of the Diagnostic Tool. Then, use one of the arguments enlisted below. - Windows PowerShell - navigate to the location of the Diagnostic Tool, right-click it, and choose to open in PowerShell. Then, use on of the arguments enlisted below.
Example:
UiPath.DiagnosticTool.exe run <[defaultProfile] | [pathToProfile> [Optional Parameter]
| Argument | Description |
|---|---|
run studio | Runs the Studio default profile. |
run orchestrator | Runs the Orchestrator default profile. |
run <pathToFile> | Runs a custom previously created, custom diagnostic profile from a generated .json file. |
-o, --output | Specifies the output of the generated .zip package containing all the collected data. |
Generating a Diagnostic Tool report
To generate a Diagnostic Tool report:
- Click Start and search for the UiPath Diagnostics Tool application.
- Select the appropriate options in the Start section and click Next.
- Configure the data in the Configure section and click Collect.
Note:
A confirmation window to delete the current progress appears when clicking Previous.
- Review the data in the Preview section and click Next.
- Click Export in the Export section.
- Save the generated .zip file on your machine.
- Send the generated .zip file to the technical support team.