- Before you begin
- Getting started
- Integrations
- Working with process apps
- Working with dashboards and charts
- Working with process graphs
- Working with Discover process models and Import BPMN models
- Showing or hiding the menu
- Context information
- Export
- Filters
- Sending automation ideas to UiPath® Automation Hub
- Tags
- Due dates
- Compare
- Conformance checking
- Root cause analysis
- Simulating automation potential
- Triggering an automation from a process app
- Viewing Process data
- Creating apps
- Loading data
- Customizing process apps
- Publishing Dashboards
- App templates
- Additional resources
- Out-of-the-box Tags and Due dates
- Editing data transformations in a local environment
- Setting up a local test environment
- Designing an event log
- Extending the SAP Ariba extraction tool
- Performance characteristics

Process Mining user guide
Analysis - Event analysis
Introduction
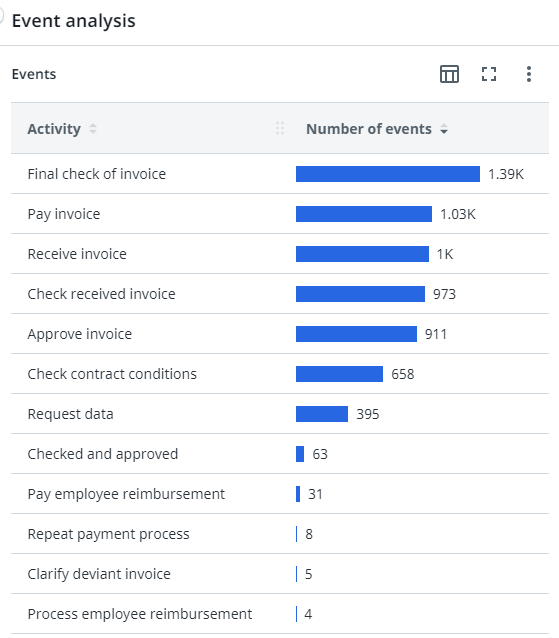
Event analysis is the dashboard where you can analyze the complete process regarding events.
Context information
The context bar at the top of the Event analysis dashboard displays context information and KPI's.
The following table describes the elements of the context bar.
| KPI | Description |
|---|---|
| Avg. number of events | The average number of events that were performed on cases, within the selected period. |
| Avg. event throughput time | The average throughput time of all events, within the selected period. |
| Number of events | The number of unique events. |
| Number of cases | The number of unique cases. |
Metrics
The Event analysis dashboard enables you to analyze activities and variants using different metrics.
The following table describes the metrics that you can select in the Events chart of the Event analysis dashboard.
| Metric | Description | Base |
|---|---|---|
| Number of cases | The total number of cases created in the selected period. | Cases |
| Number of events | The total number of all events in the selected period. | Event log |
| Avg. number of events | The average number of events that were performed on cases, within the selected period. | Event log |
| Avg. event throughput time | The average throughput time of all events in the selected period. | Event log |
Events
The Event analysis dashboard enables you to analyze process regarding events based on a different fields and metrics.
Variant
A variant is a specific path through the process, a set of activities that were taken in a specific order. Usually, several cases have followed the same variant.
When you select Variant, the number of various process paths different cases have taken from end-to-end is displayed.

Distribution
The Distribution chart enables you to analyze the frequency of events based on the Throughput time.

Process graph
The process graph displays the end-to-end process based on the number of cases.
You can use the Detail slider to change the number of activities and/or edges shown. Check outWorking with Process Graphs.
Activity metrics
| Metric | Description | Base |
|---|---|---|
| Number of cases | The number of unique cases. | Cases |
| Avg. case value | The average case value of cases created during the selected period. | Cases |
| Total case value | The sum of the values of the cases created during the selected period. | Cases |
| Number of events | The total number of events. | Event log |
| Avg. number of events | The average number of events. | Event log |
| Avg. event throughput time | The average throughput time for the end-to-end process. | Event log |
| Total event throughput time | The total throughput time for the end-to-end process. | Event log |
Edge metrics
| Metric | Description | Base |
|---|---|---|
| Number of cases | The number of unique cases. | Cases |
| Average throughput time | The average throughput time between the activities. | Process |
| Number of transitions | The number of transitions between the activities. | Process |