- Getting started
- For administrators
- RPA workflow projects
- Creating an RPA workflow from an idea
- Creating a project
- How to start an RPA workflow
- Managing project files and folders
- Connecting RPA workflows to your accounts
- Configuring activities
- Managing the activities in a project
- Passing values between activities
- Iterating through items
- Managing the data in a project
- Configuring a project to use your data
- Using file and folder resources
- Local setup for RPA workflow and app projects
- App projects
- Agentic processes
- Agents
- Solutions
- API workflows
- Tests
Studio Web user guide
To debug your agentic process, you can either:
- Select Debug from the toolbar above the designer. The entire project is run, starting with the first element. When you run the project, you can select Stop to stop the execution and return to design mode.
- Select Debug step-by-step to debug your project one element at a time, allowing you to validate each step along the way. The following options are available when you run step-by-step:
- Stop - Stops the execution and lets you return to design mode.
- Continue - Runs all remaining steps or until the first breakpoint is reached.
- Next step - Runs only the next step.
A User task element creates a task and waits for it to complete. To continue debugging, go to Action Center to complete the task.
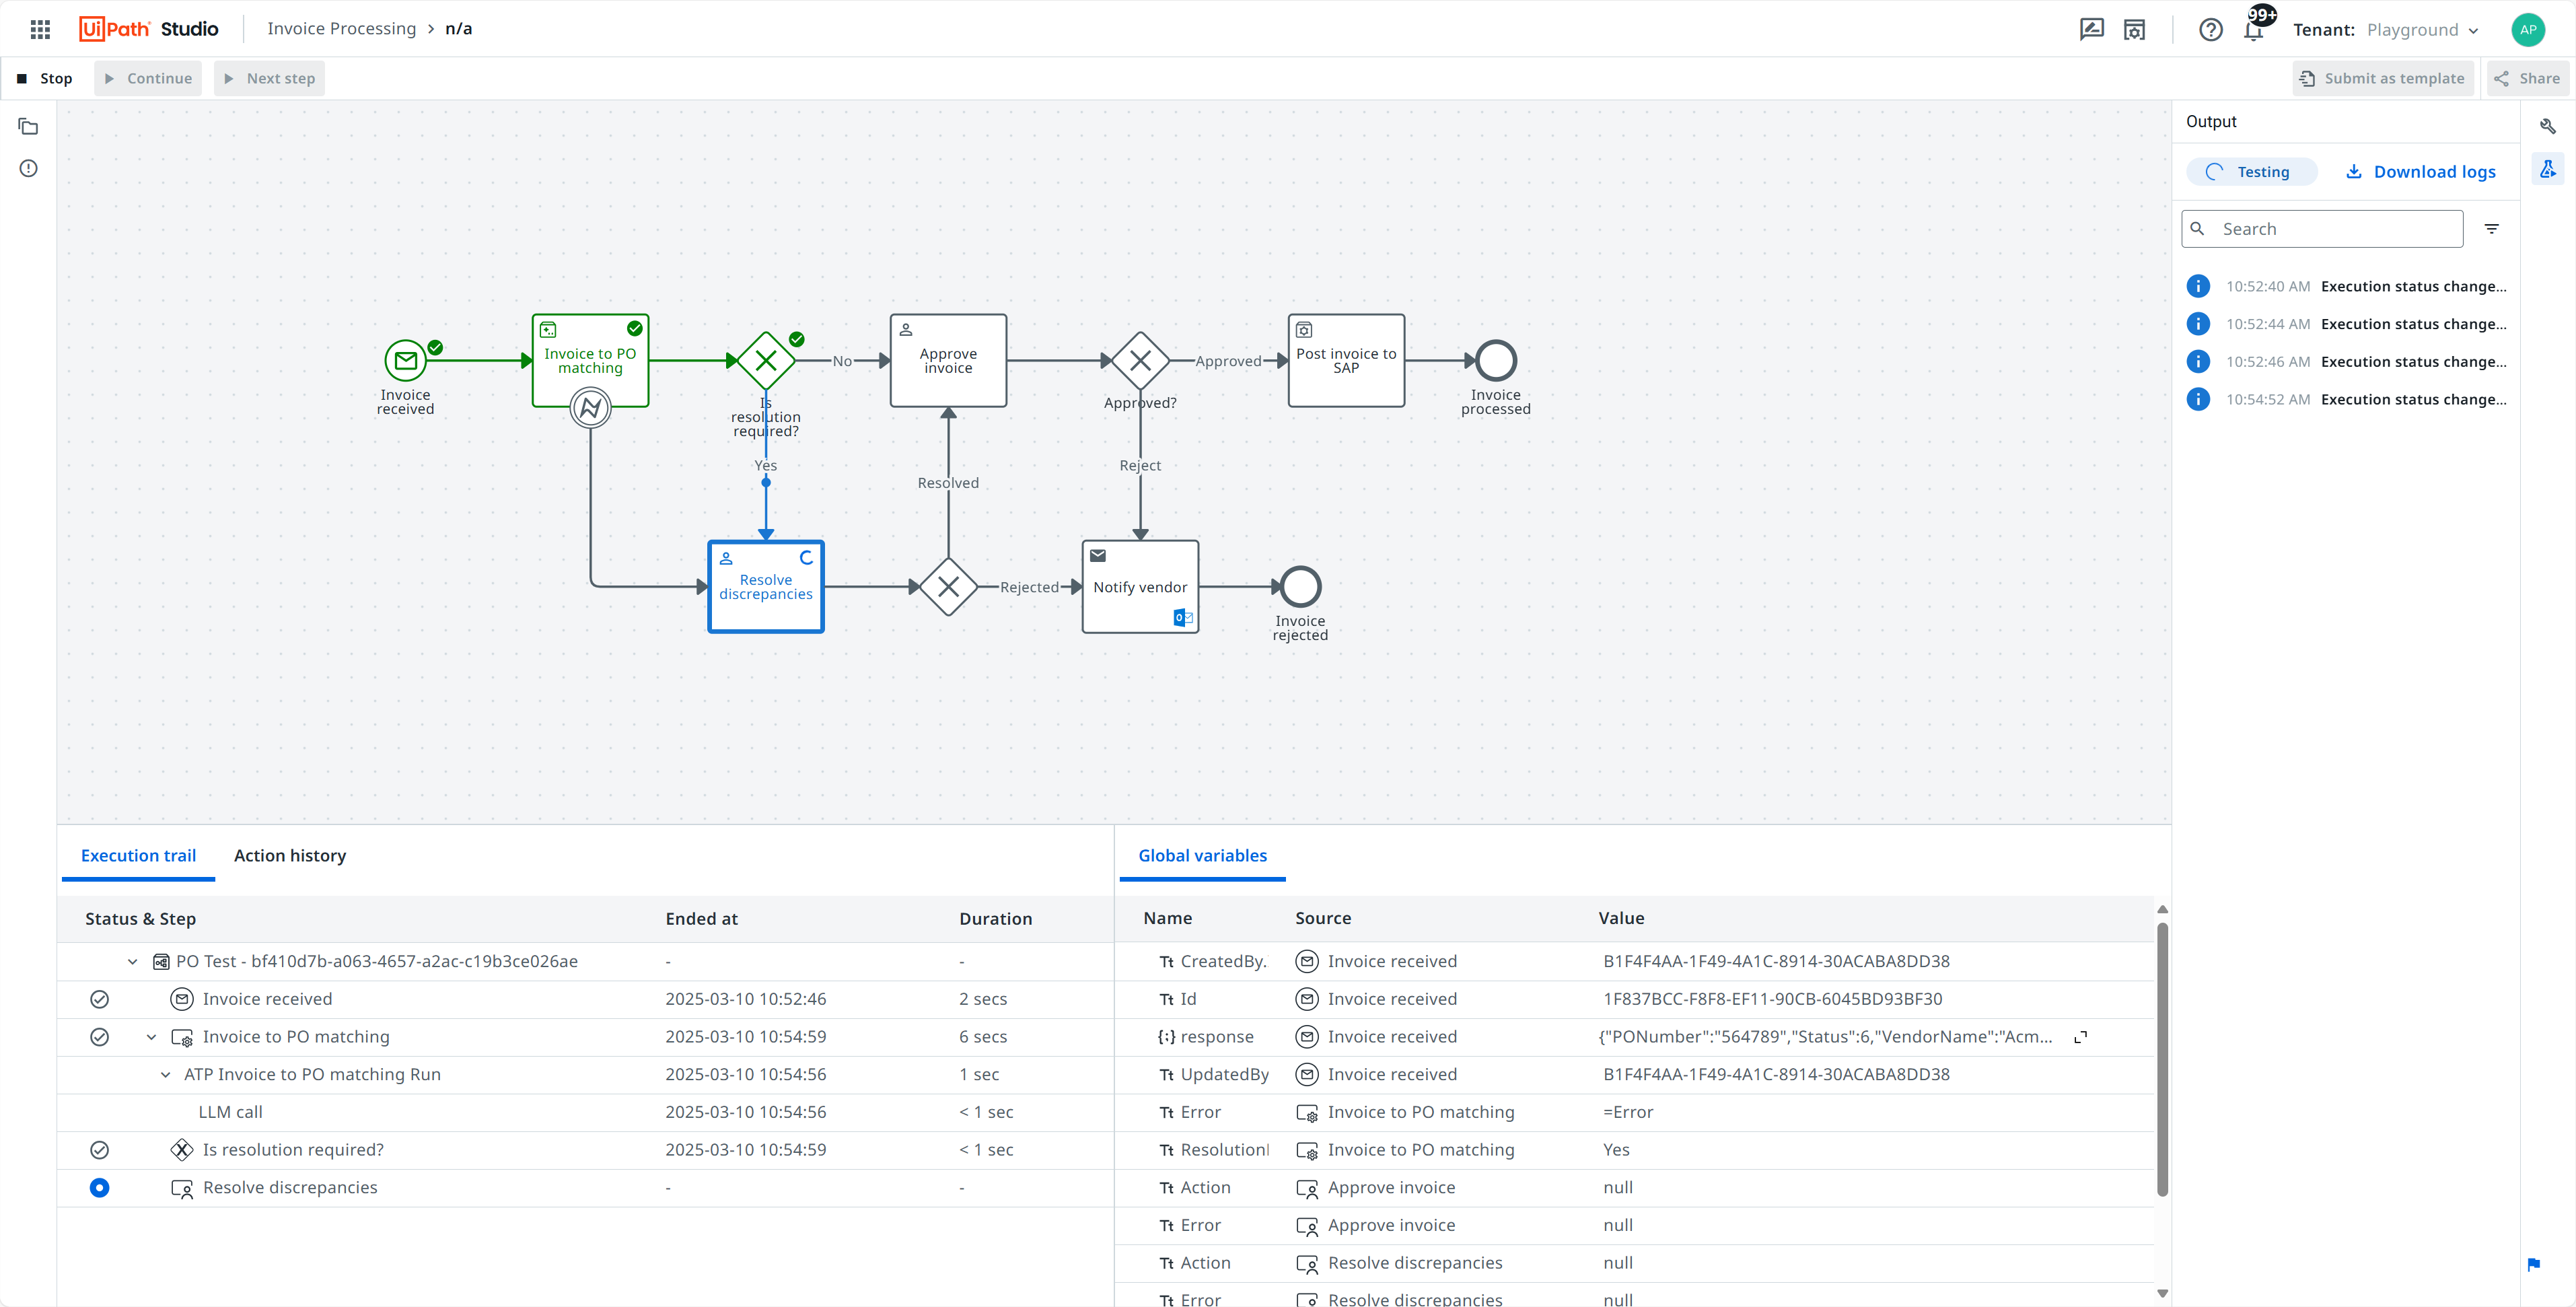
While the agentic process is now running in debug mode, you can now interact with the elements that are executed and examine their details:
-
The Run output panel shows details about the progress of each run.
-
The Global variables panel displays the values of the variables for the entire process.
-
The Execution trail panel shows detailed information (Details) and variable values (Variables) for each step in the execution. Select the expand button to see additional variable details.
-
The Action history panel displays the comments logged from any manual interactions during execution.

You can also set breakpoints on elements to see how they are executed.
To set a breakpoint on an element:
- Start the debugging process.
- Hover over an element in the designer.
- Select the
 breakpoint icon to add a breakpoint.
You can also add a breakpoint by right-clicking an element and selecting Add breakpoint while debugging step-by-step.
When a breakpoint is triggered in an agentic process, the process engine will pause execution so you can examine the execution details.
To remove a breakpoint, hover over the element that contains the breakpoint and select the  remove breakpoint icon.
