- Getting started
- Best practices
- Tenant
- About the Tenant Context
- Searching for Resources in a Tenant
- Managing Robots
- Connecting Robots to Orchestrator
- Storing Robot Credentials in CyberArk
- Storing Unattended Robot Passwords in Azure Key Vault (read only)
- Storing Unattended Robot Credentials in HashiCorp Vault (read only)
- Storing Unattended Robot Credentials in AWS Secrets Manager (read only)
- Deleting Disconnected and Unresponsive Unattended Sessions
- Robot Authentication
- Robot Authentication With Client Credentials
- SmartCard Authentication
- Configuring automation capabilities
- Audit
- Configuring Alerts
- Alert Emails
- Setting up Alert Emails
- Settings - Tenant Level
- Resource Catalog Service
- Folders Context
- Automations
- Processes
- Jobs
- Triggers
- Logs
- Monitoring
- Queues
- Assets
- Storage Buckets
- Orchestrator testing
- Other Configurations
- Integrations
- Host administration
- About the host level
- Managing system administrators
- Managing tenants
- Configuring system email notifications
- Audit logs for the host portal
- Maintenance Mode
- Organization administration
- Troubleshooting

Orchestrator user guide
Alert Emails
Overview
Alert emails are separated into two report types:
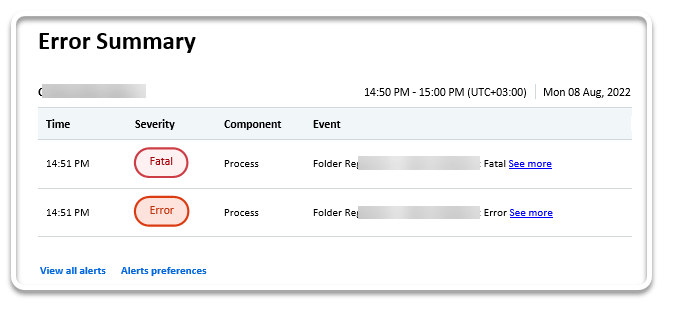
- an error summary - it provides information about the Fatal and Error alerts in the folders you have access to, that occurred in ten-minute batches of time.
- a daily summary - it provides information about all the alerts in the folders you have access to, generated in the past 24h.
Let us deep dive into each report type:
The Error Summary Report
This ten-minute report notifies you of the Fatal and Error alerts associated with:
- the events selected on the Alerts preferences page, and
- the folders you have access to.
The summary is sent via email every ten minutes, and it displays the following information:
-
the number of new alerts in the last ten minutes
-
the tenant name
-
the ten-minute batch timestamps
-
the alert UTC timestamp
-
the severity level
-
the affected component
-
the specific event that triggered the alert
-
the link to the alert source, to help you remediate it
Note:Email and alert timestamps are rendered in the tenant time zone.

The See More Link
The error summary report provides several hyperlinks, to redirect to different locations in Orchestrator. The See more hyperlink redirects you to the alert source. This opens a custom filtered page which displays the component that generated the alert.
The Alerts Summary Report
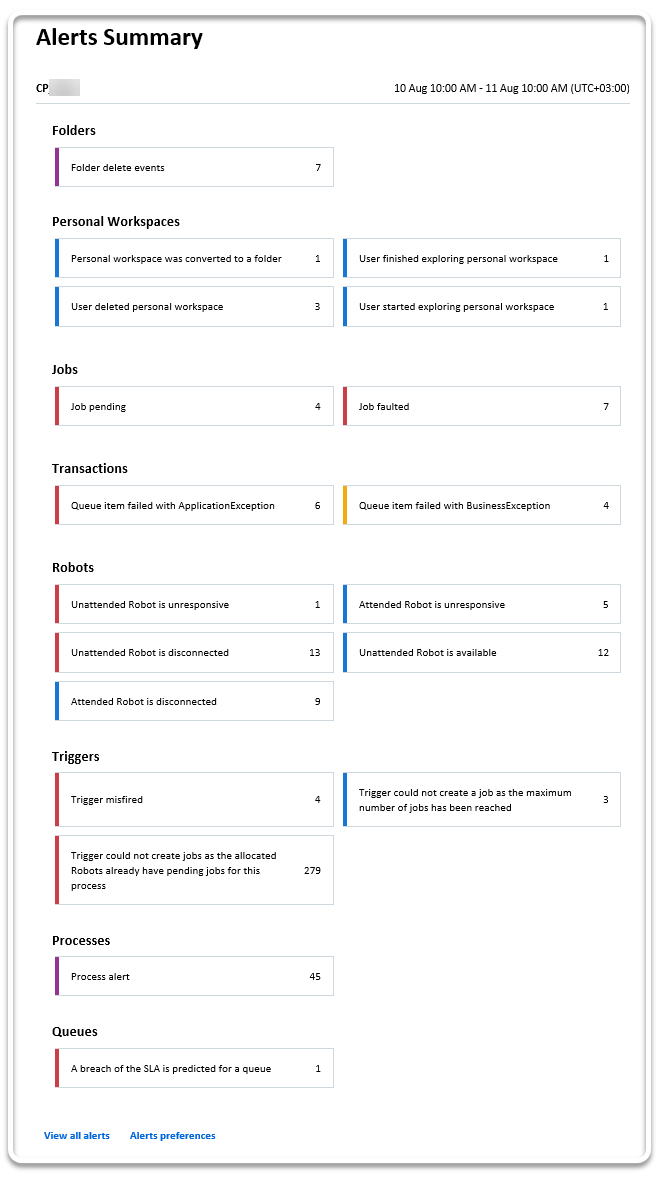
This daily email report counts how many specific alerts per the associated event occurred in your tenant in the past 24h.
The dashboard is sent via email at 7 a.m. in your tenant time zone, and it displays the following counts based on your selection on the Alerts preferences page.
If you do not receive the daily email report, this means no alerts were generated in the last 24 hours.
The colors of the alert cards are correlated to their severity levels.
To see all the alerts from the last day, click View all alerts from the dashboard email.
To manage your alert subscriptions, click Alerts preferences from the dashboard email.

Sending Daily Alert Emails
Daily alert emails are sent at 7 a.m. in your tenant time zone, ignoring the daylight saving. For multiple time zones, the algorithm chooses the easternmost time zone. The following table summarizes the attempted sending time per tenant region:
| Tenant region | Tenant time zone | UTC converted time zone |
|---|---|---|
| EU | CET | UTC+1 |
| US GXP Gov | EST | UTC+5 |
| Canada | EST | UTC+5 |
| Australia | AET | UTC+10 |
| Japan | JST | UTC+9 |
| Singapore | SGT | UTC+8 |