- Before you begin
- Getting started
- Activities
- Designing long-running workflows
- Start Job And Get Reference
- Wait For Job And Resume
- Add Queue Item And Get Reference
- Wait For Queue Item And Resume
- Create Form Task
- Wait For Form Task And Resume
- Resume After Delay
- Assign Tasks
- Create External Task
- Wait For External Task And Resume
- Complete Task
- Forward Task
- Get Form Tasks
- Get Task Data
- Add Task Comment
- Update Task Labels
- Actions
- Processes
- About processes
- Exploring processes
- Managing processes
- Notifications
- Audit
- Troubleshooting
Action Center user guide
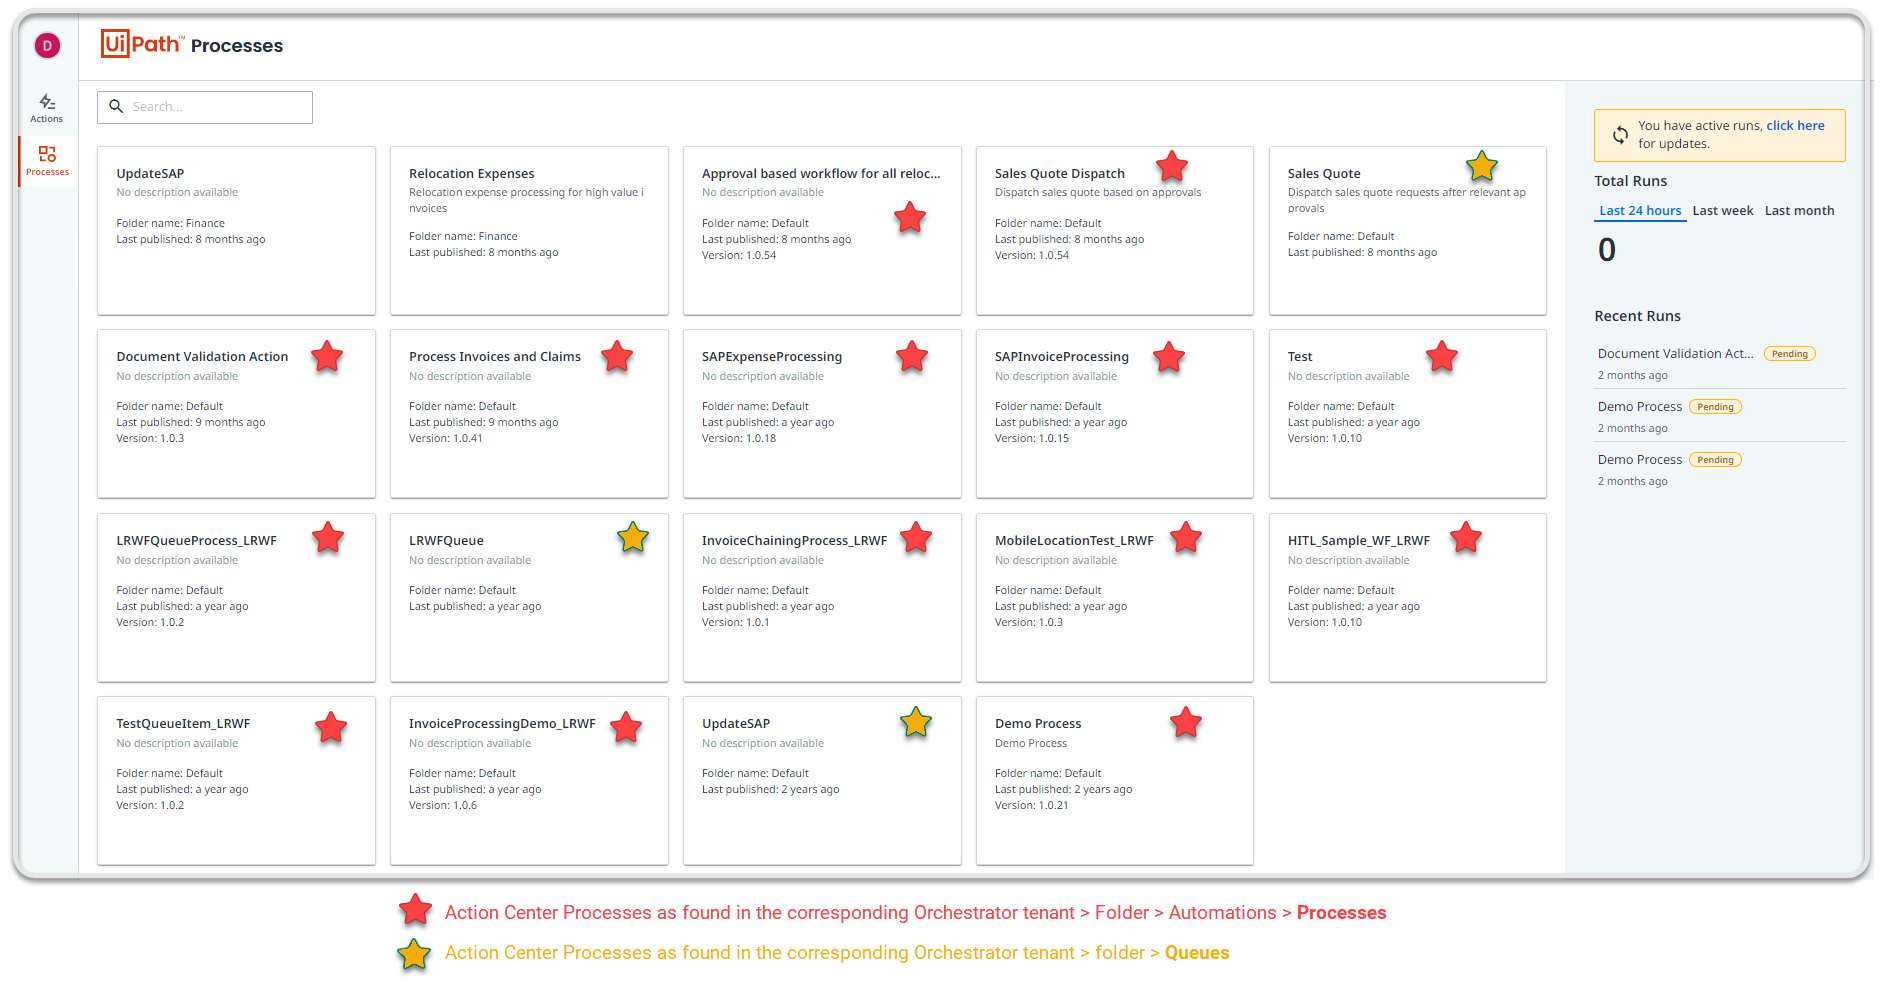
The Processes, that generate Actions in Action Center, are all queues and unattended processes from the Orchestrator folders that you have access to.

Prerequisites
- You are in the correct Orchestrator folder context.
- You have the right user permissions to view and manage processes.
Accessing processes
To access processes, navigate to the Processes tab from the left-hand menu.
Displaying processes
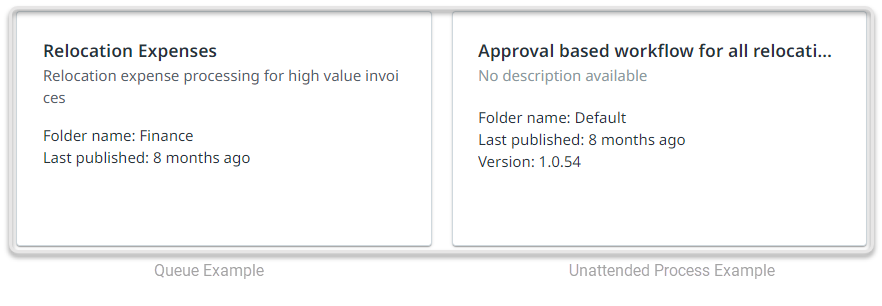
A card is displayed for every queue or unattended process found in the Orchestrator folders that you have access to, containing the following details:
-
Process name.
-
Description.
-
Recipient folder name.
-
Latest publishing date and time .
-
Published package version (for processes only).

Running processes
- To run an unattended process, hover over the process card and click Run
 .
. - To trigger an unattended process using a queue, provide the queue schema. For a sample workflow, click here.
- To trigger an unattended process using a file upload, provide the file.
For more information about how to trigger an unattended process using a file upload, go here.
Viewing details
To view a specific process detail, hover over the process card and click View details .
.
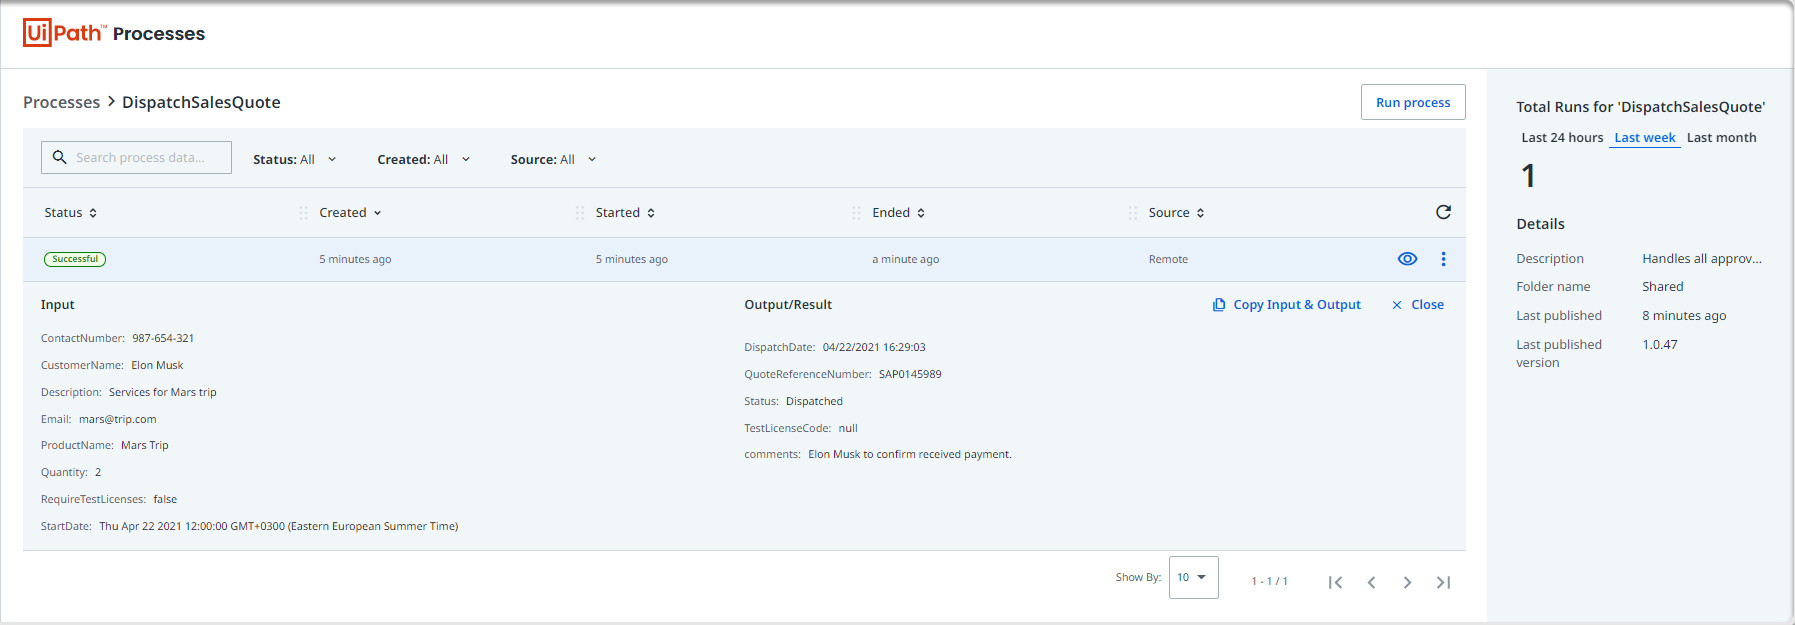
The Details page opens, displaying an entry for every process run, with the following details:
- Status.
- Creation date.
- Start date.
- End date.
- Source (for processes).
- Exception (for queues).
To view more specific details, select View process data for a specific entry. This expands the Input and Output/Result data of the corresponding process, to help you track the changes made between entries.
To restart a process, kill it, or remove it from the entries list, click More options  .
.

Viewing logs
Viewing logs is not available for processes in New state. To debug your processes or just to track their executions:
- On the View Details page of the selected process, open the More Actions
 menu for a specific run.
 - Click View logs. The logs page opens, listing all the registered logs for the selected process execution.
- For more details about a log entry, click View detail. The Log Detail window opens.
Downloading logs
To download the logs to your machine in CSV format, click Download.
Additional information: We recommend downloading logs periodically to keep them beyond the 30 days retention period.
Checking the wait events of suspended processes
Every time a job or queue enters the suspended state, a new trigger containing the latest wait events is created. To check the events processes in Suspended state:
- Access the View Wait Events page.
- On the View Details page of the selected process, open the More Actions
 menu for the Suspended execution.
 - Click View wait events.
Result The wait events page opens, listing the following suspension details:
- Status—the process corresponding trigger status;
- Wait Event Type—the type of the event the processes is waiting on ( Task,Queue Item,Job,Time Delay);
- Identifier—the ID of the event the process is waiting on;
The ID relates to the wait event type, as follows: Task -> Action ID, Queue Item -> Queue ID, and Job -> Job ID.
-
Title—the name of the corresponding queue or process;
-
Assignee—the currently assigned user to complete the action (This field is populated only for wait events of type Task). If empty, the task is unassigned.
-
Time Delay—the time stamp of the process resumption (This field is populated only for wait events of type Time Delay).
-
Created—the time stamp of the process creation;
-
Last Modified—the time stamp of the process last revision;
-
Status Message—the status message set in the corresponding Wait and resume activity.

Total runs
The Total Runs panel provides simplified analytics of the total number of runs for the corresponding process, in the indicated time span (last 24 hours, last week, or last month). On the main page of the service, the analytics refer to the total runs of all processes, displaying the recent ones and their status.