- Getting started
- Best practices
- Tenant
- About the Tenant Context
- Searching for Resources in a Tenant
- Managing Robots
- Connecting Robots to Orchestrator
- Storing Robot Credentials in CyberArk
- Storing Unattended Robot Passwords in Azure Key Vault (read only)
- Storing Unattended Robot Credentials in HashiCorp Vault (read only)
- Storing Unattended Robot Credentials in AWS Secrets Manager (read only)
- Deleting Disconnected and Unresponsive Unattended Sessions
- Robot Authentication
- Robot Authentication With Client Credentials
- SmartCard Authentication
- Configuring automation capabilities
- Audit
- Settings - Tenant Level
- Resource Catalog Service
- Automation Suite Robots
- Folders Context
- Automations
- Processes
- Jobs
- Apps
- Triggers
- Logs
- Monitoring
- Queues
- Assets
- Storage Buckets
- Orchestrator testing
- Integrations
- Troubleshooting

Orchestrator user guide
Alerts
Overview
This article provides information about Orchestrator built-in alerts. You can also send custom alerts to Orchestrator using the Raise Alert activity.
Alerts are notifications related to robots, queue items, triggers, and more. You receive alerts for all the folders you can access via four means:
-
the alerting banner - a banner that displays alerts as they occur

-
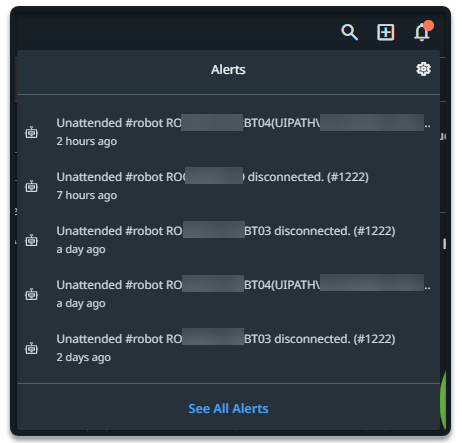
the Alerts panel - accessible from the Alerts bell, displays the most severe five alerts

-
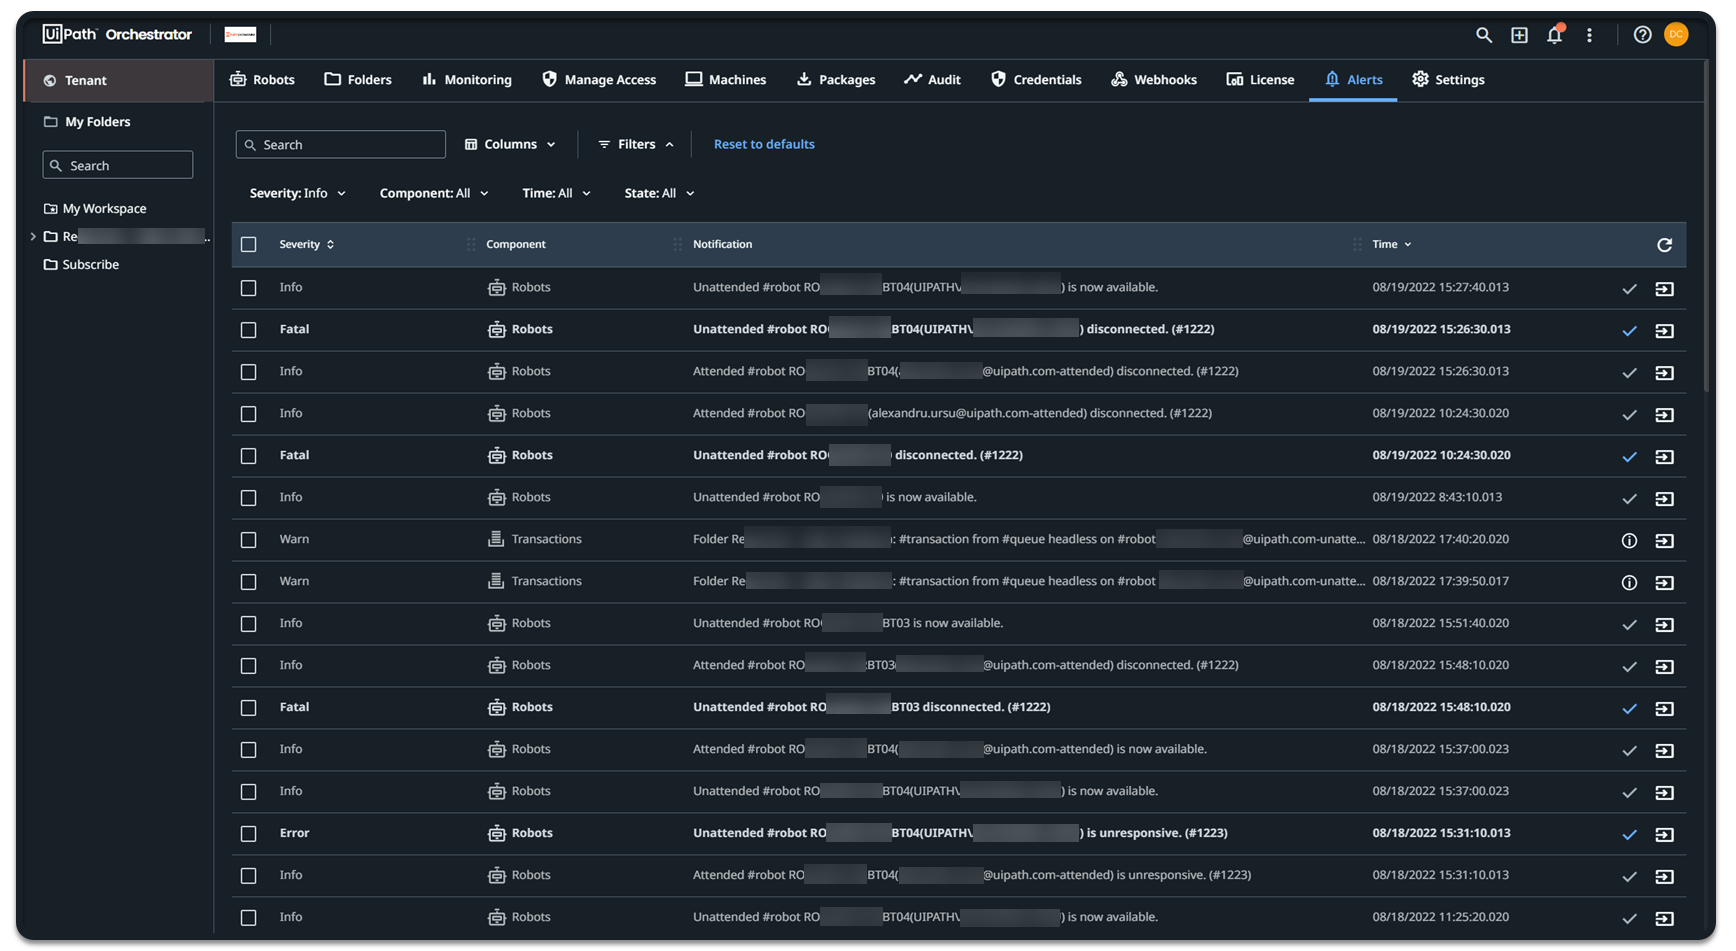
the Alerts page - a more comprehensive list of all alerts

-
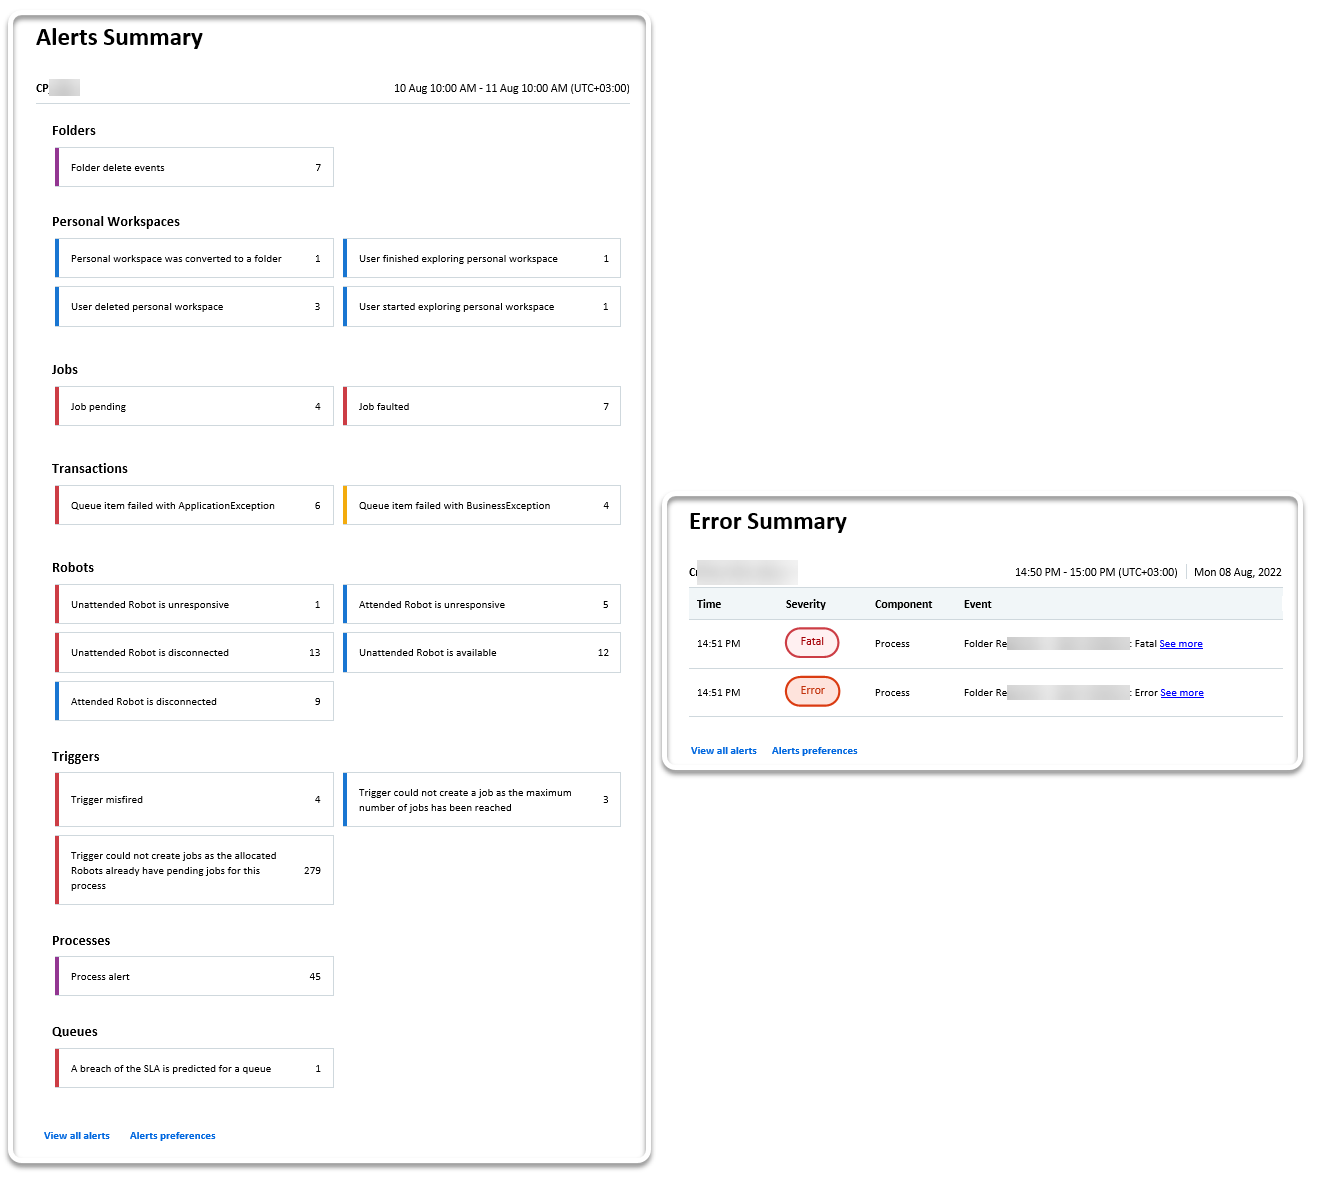
alert emails - summaries of the alerts you subscribed to, received as error reports every ten minutes, or as daily reports

As an administrator, you can control the alerts each of your users receive:
- by accessing their alert preferences profile and select specific events or
- by restricting the alerts from a specific folder.
As a user, you can set your own alert preferences, which apply to every folder you have access to.
To receive alert emails, you need to enable the emailing mechanism and set up a SMTP server.
Alerts Permissions
To view alerts, you need the following permissions:
- View permissions on Alerts at the tenant level,
- View permissions on the specific component in the folder you need to receive alerts from. For example, to receive alerts for triggered automations in the "Finance" folder, your administrator must provide you with:
- View permissions on Alerts,
- access in the "Finance" folder,
- View permissions on Triggers in the "Finance" folder
The following table shows the additional folder or tenant permission you need per each alerting component:
| Orchestrator component | Permission context | Permission set |
|---|---|---|
| Unattended robots | Tenant | Machines |
| Folder | Monitoring | |
| Attended robots | Tenant | Robots |
| Folder | Monitoring | |
| Transactions | Folder | Queues |
| Triggers | Folder | Triggers |
| Jobs | Folder | Jobs |
| Process | Folder | Processes |
| Queues | Folder | Queues Monitoring |
| Folders | Tenant | Folders |
Known issue If an alert requires two permissions, those permissions must be granted via direct user-level assignment or via the same group. If they are granted via two separate groups, the alert is not sent. If you choose to assign permissions via groups, these are the permission combinations that you need to grant to make sure that users receive alerts:
- For alerts covering tenant-scoped actions, grant the following permissions to the same group:
- View on Alerts at the tenant level
- View on the specific tenant-scoped component at the tenant levelExample: The "Machine disconnected" alert requires View on Alerts and View on Machines at the tenant level, within the same group.
- For alerts covering folder-scoped actions, grant the following permissions to the same group:
- View on Alerts at the tenant level
- View on the specific folder-scoped component at the folder levelExample: The "Job faulted" alert requires View on Alerts at the tenant level and View on Jobs at the folder level, within the same group.
Alert Severity Levels and Subscriptions
Alerts inform you about the component status in the automation flow. The information is split into different types of severity, helping you track an execution or identify the faulty ones.
There are five severity levels, to indicate the state of your process execution:
- Info
- notifies you about low importance events, that do not interrupt the process execution.
- Success
- notifies you about a successful status.
- Warn
- notifies you about possible risky events that may interrupt your process execution, but any interruption can be recovered.
- Error
- notifies you about imminent risky events that prevent the process from executing successfully.
- Fatal
- notifies you about events that force-stops the process execution.
- Various
- the triggering event may have distinct severity levels.
Orchestrator severity levels are established by UiPath® and cannot be edited.
You can subscribe to specific component events, so your inbox would not get crowded by alerts that do not provide you adequate value. Some components do not allow subscriptions, however you can see their associated alerts on the Alerts page.
Alerts That Allow Subscription
The following table summarizes the events that allow subscription, their corresponding severity level, and the permission required to receive that alert.
Once the permission is set and you are subscribed to any of these events, you start receiving alerts in the Alerts panel and via email.
| Component | Alert | Severity level | Permission required |
|---|---|---|---|
| Robots | "Unattended Robot is available." | Info | View on Machines |
| "Attended Robot is unresponsive." | Info | View on Users | |
| "Unattended Robot is unresponsive." | Error | View on Machines | |
| "Attended Robot is disconnected." | Info | View on Users | |
| "Unattended Robot is disconnected." | Fatal | View on Machines | |
| Jobs Learn how to generate alerts for jobs. | "Job faulted." | Error | View on Jobs |
| "Job stuck in pending or resumed." | Error | ||
| "Job not finished." | Error | ||
| Triggers | "Trigger misfired." Generated when the trigger fired later than it was configured, or when the firing was skipped. | Error | View on Triggers |
| "Trigger could not create jobs as the allocated Robots already have pending jobs for this process." Occurs on time triggers. | Error | ||
| "Trigger could not create a job as the maximum number of jobs has been reached." Occurs on queue triggers. | Info | ||
| "Trigger automatically disabled after job creation failures." Generated when a trigger is automatically disabled, because it failed to create jobs too many times consecutively. | Fatal | ||
| Transactions | "Queue item failed with BusinessException." | Warn | View on Transactions |
| "Queue item failed with ApplicationException." | Error | ||
| "User assigned as reviewer for failed/abandoned queue item." | Info | ||
| Queues | "A breach of the SLA is predicted for a queue." | Error | View on Queues |
| "Retention for queue failed." | Error | ||
| Export | "Export completed." | Success | N/A |
| "Export failed. Please retry your export." | Error | ||
| Cloud Robots | Cloud Robots pool events. | Various | View on Machines |
| Cloud Robots virtual machine events. | Various |
Alerts That Do Not Allow Subscription
The following table summarizes the alerts that do not allow subscription and their corresponding severity level. These alerts are displayed on the Alerts page and included in the daily summary email.
| Component | Alert | Severity level |
|---|---|---|
| Process | Custom messages, configured using the Raise Alert activity | Custom severity level |
| Folders | "Folder was successfully deleted." | Success |
| "The folder was restored." Generated in case of a failure. | Error | |
| "Deletion of folder failed. The folder was restored as [automatic_folder_name]." Generated in case of a failure and when a new folder with the same name is created at the same time, which means the original folder is renamed at restore. | Error | |
| Personal Workspaces | "User started exploring your personal workspace." Sent to the owner of a personal workspace when an admin begins exploring their workspace. | Info |
| "User finished exploring your personal workspace." Sent to the owner of a personal workspace when an admin stops exploring their workspace. | Info | |
| "Your personal workspace was converted to a folder." Generated when a personal workspace is converted to a folder. | Info | |
| "User deleted your personal workspace. A new empty personal workspace was created for you." Sent to the owner of a personal workspace when their workspace is deleted. | Info | |
| "Enabling personal workspaces successfully completed." Generated when bulk enabling personal workspaces succeeds. | Success | |
| "Enabling personal workspaces failed." Generated when bulk enabling personal workspaces fails. | Error | |
| Test Automation | Distinct messages about bulk operations with queue items. | Info |
| Triggers | "Trigger automatically disabled after job execution failures." Generated when a trigger is automatically disabled because its associated job failed to execute 5 times consecutively. | Fatal |
Subscribing to Alerts
The Alerts preferences page allows you to subscribe to the events you want to receive alerts about.
The preferences configured on this page apply to all folders you have access to in the tenant.
However, an administrator can activate or deactivate the alerts for any user in a folder. See Enabling/Disabling user alerts per folder for more information.
The choices you make on the Alerts preferences page can be overwritten by your organization administrator. See Setting Alert preferences per user for more details.
To subscribe to the specific events:
- Navigate to the Alerts preferences page:
- Click the Alerts icon
 . The Alerts panel opens.
 - Click the cog icon
 . The Alerts preferences page opens in the tenant context. That is, the options made here apply to all the folders you have access to.
- Click the Alerts icon
- Select the events, based on the associated component or on the severity level.
Selecting or deselecting the parent component checkbox automatically selects/deselects all associated events.
Alert Notifications
There are two ways Orchestrator notifies you of new alerts, and they do not mutually exclude each other:
- email - alerts received via email, every ten minutes and daily
- in Orchestrator - alerts received in the Alerts panel
Email
If you want to always be up to date with the changes happening to your automations, you can activate alert emails.
Alert emails provide ten-minute or daily summaries for the subscribed events:
- the ten-minute summary reports only the Fatal and Error alerts that occurred in a ten-minute time frame, across all folders you have access to.
- the daily summary reports all subscribed alerts that occurred in your tenant, across all folders you have access to. Reports start collecting alerts every day at 10 a.m of your tenant time zone.
Read more details about alert emails.
In the Alerts Panel
Once subscribed, you start receiving alerts in Orchestrator via the Alerts panel. When a new alert is logged, the alert icon displays a red dot. This means you have unread alerts.
The Alerts panel displays the most severe five alerts.
Clicking an alert in the panel redirects you to the custom filtered page of the associated component. For example, if you receive the "Job faulted" alert and you click it, the *Jobs opens, filtered to display the faulted job.
Click See all alerts to navigate to the Alerts page of your tenant.
Alerts Page
The Alerts page is a centralized location displaying all the alerts in your tenant, across all folders you have access to. It provides information that allow you to identify and track down the faulted components.
To narrow down the list of alerts, you can use the following filters:
- Severity - when filtering by a certain severity, Orchestrator displays all alerts with a severity that is equal or higher than the selected one. The severity level hierarchy is as follows, from most severe to least severe:
- Fatal > Error >Warn > Success > Info. For example, if you filter by Warn, Orchestrator displays Warn,Error, and Fatal alerts, excluding Success and Info, which are lower than Warn.
- Component - filtering by a component displays the alerts on that certain component.
- Time - filtering by time intervals displays the alerts that occurred during the selected interval. The available filter options are Last hour,Last day,Last week,Last 30 days, and All.
- State - filtering by state displays either Unread,Read, or All alerts.
At the end of each alert row, there are two actionable buttons, of the following types:
- Mark As Read - marks the corresponding alerts as read. By default, all alerts with Info,Success, and Warn severity levels are marked as read on the Alerts page.
- Show Details - opens the details panel for the associated component.
- See alert source - redirects you to a custom filtered page of the component that generated the alert.
Alert Sources
The following actions redirect you to the alert source, so you can see details about the specific component that triggered the alert:
- Clicking See alert source on the Alerts page
- Clicking See more in the Error summary email
- Clicking the alert in the Alerts panel
Note:
Alerts generated while debugging Studio processes do not provide redirect links.