- 基本情報
- インストール
- ScreenPlay をインストールする
- ベスト プラクティス
- データのコレクション
- Running and inspecting the execution results
- ScreenPlay Variable Security

ScreenPlay ユーザー ガイド
Running and inspecting the execution results
After configuring your ScreenPlay prompt, take the following steps:
- Run the automation in Debug mode.
- Once the run completes, you can review how the agent interpreted and executed your prompt:
- Go to Debug, then select Open Logs in Studio.
- Open the ScreenPlay folder.
- Inspect the most recent
.htmlfiles.
Each HTML file contains an execution trace that details how the ScreenPlay agent reasoned about the prompt, identified UI targets, and executed each action. This trace provides visibility into the decision-making process and helps validate or troubleshoot ScreenPlay behavior.
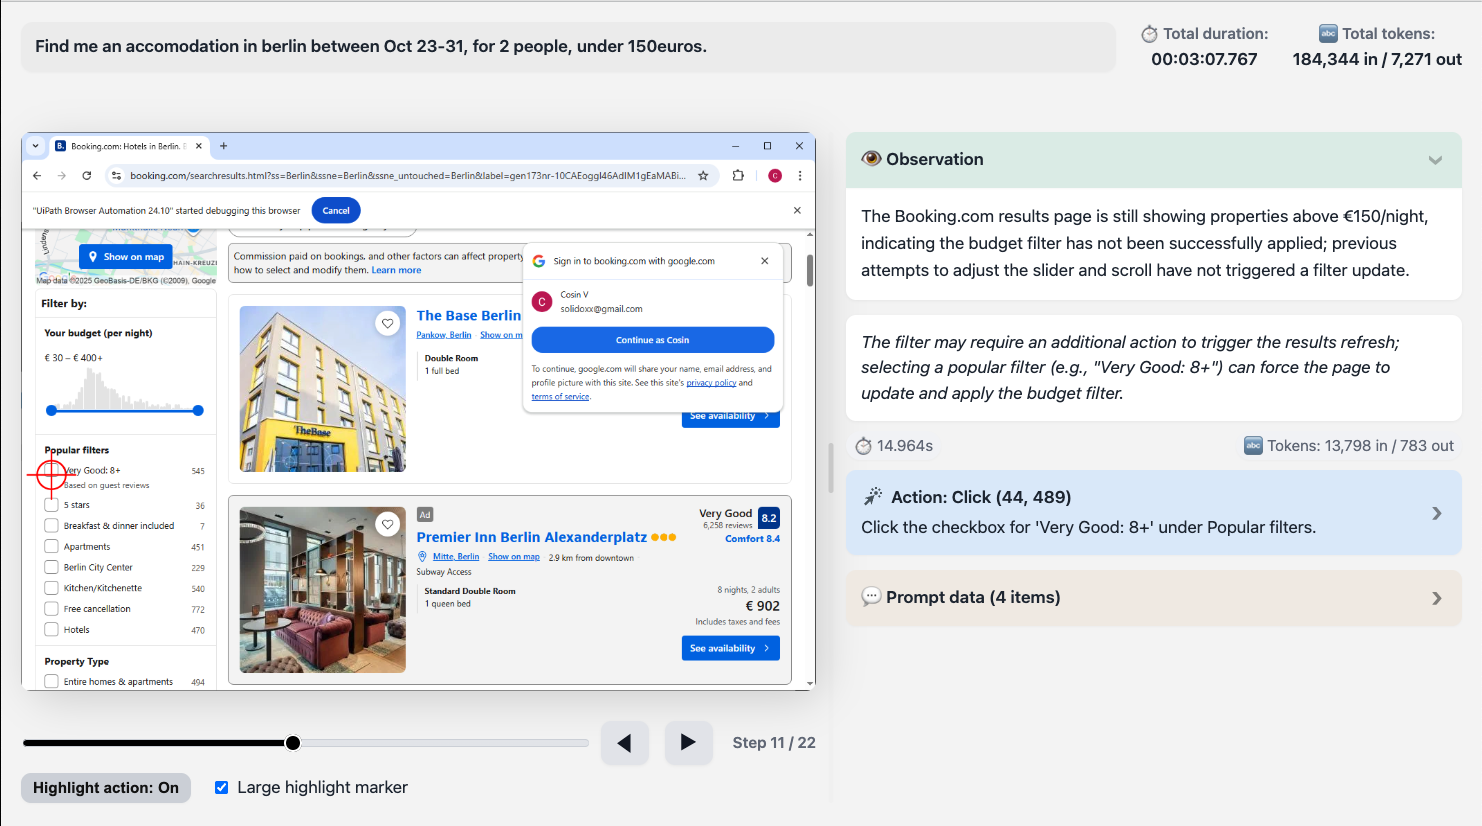
The ScreenPlay Execution Trace HTML file
The ScreenPlay Execution Trace HTML file provides a complete visual and diagnostic record of a ScreenPlay automation run. It captures prompt input, AI reasoning, on-screen actions, and timing metrics in a structured, interactive format.
You can use this file to inspect and validate how ScreenPlay interpreted a prompt, which UI elements were targeted, and how each automation step executed across the interface.
The file is automatically generated by default. You can change this setting in Project Settings, then select UIAutomation Modern, then go to ScreenPlay, where you can also set the number of days the trace files are being stored for.

概要
When you run a ScreenPlay automation, the execution trace is automatically generated as an .html file. This file combines:
- Natural language prompt data.
- Step-by-step UI snapshots with bounding boxes.
- Timing and token metrics.
- Diagnostic sections for reasoning and errors.
You can open the HTML file in any modern web browser to review or share the complete execution sequence.
File structure
Each ScreenPlay trace file follows a consistent internal structure with the following top-level sections.
| セクション | 説明 |
|---|---|
| ヘッダー | Displays the prompt, trace ID, and timestamp of execution. |
| Overall Metrics (Grand Totals) | Summarizes total runtime, processing times, and token usage. |
| Player Container | Contains the visual replay component — screenshots, highlights, and step navigation. |
| Iteration Blocks | Each iteration (step) in the agent’s reasoning or execution cycle. Includes screenshots, reasoning, and metrics. |
| Diagnostic Sections | Optional panels for AI reasoning, activity data, and error messages. |
Header fields
The following tables describes the header fields and examples:
| フィールド | 例 | 説明 |
|---|---|---|
| プロンプト | create a random RPA supplier | The natural language instruction that initiated the automation. |
| Trace ID | 3b97584d-7fc0-43f6-830b-fc45c21811b3 | A unique identifier for this execution trace, used for reference or comparison. |
Overall metrics
The Grand Totals section summarizes key performance data from the execution.
The following table describes the overall metrics:
| メトリック | 説明 |
|---|---|
| 合計時間 | The total time taken to complete the execution, including perception, reasoning, and action phases. |
| Cache / DOM / Server / Actions (tooltip) | Breakdown of elapsed time in each subsystem (e.g., cached responses, DOM scanning, reasoning, and UI actions). |
| Total tokens | Tracks token input/output if the trace includes AI language model reasoning. Useful for debugging LLM usage. |
Step frames
Each step-frame, or execution step, represents one iteration of reasoning and action by the ScreenPlay agent.
The following table describes each element and their purpose.
| 要素 | 目的 |
|---|---|
| Step number (data-step="1") | Identifies the sequence order of the step. |
| スクリーンショット | A captured image of the application window or desktop at the moment of execution. |
| Canvas coordinates (data-coordinates) | JSON-encoded bounding boxes for detected or interacted elements. |
| Iteration header | Displays the step title, preview of reasoning, and duration summary. |
| Iteration content | Contains expanded detail, including reasoning text and any execution metadata. |
Diagnostic sections
Each iteration may include one or more expandable sections, as described in the following table:
| Section name | 目的 |
|---|---|
| Thinking | Displays AI reasoning and intent interpretation (if reasoning is enabled). |
| Step info | Shows contextual information about the element targeted, selector, or detected UI control. |
| Error | Indicates a failure, with visual cues in red; includes error messages, exception traces, or fallback actions. |
| Activity data | Displays structured execution data, including activity type, arguments, and targeted applications. |
Screenshot viewer and player controls
ScreenPlay traces include a built-in player for navigating through each captured frame.
The following table describes each control.
| 制御 | 説明 |
|---|---|
| Next / Previous buttons | Navigate between sequential steps. |
| Step range slider | Jump directly to a step in the sequence. |
| Toggle highlights | Overlay bounding boxes defined in the data-coordinates field to visualize clicked or typed areas. |
| Screenshot container | Displays the rendered image or placeholder if no image is available. |
Visual overlays
Each step can include overlays to indicate UI interaction types, as follows:
- Click – Rectangle drawn over a button or clickable area.
- Type – Highlight around input fields.
- Hover / Drag – Outline showing movement or cursor position.
- Error marker – Red overlay on a failed element action.