agents
latest
false
- 入门指南
- 安装
重要 :
新发布内容的本地化可能需要 1-2 周的时间才能完成。

ScreenPlay 用户指南
上次更新日期 2025年12月8日
运行并检查执行结果
配置ScreenPlay提示后,请执行以下步骤:
- 在调试模式下运行自动化。
- 运行完成后,您可以查看智能体如何解释和执行您的提示:
- 转到“调试” ,然后选择“在 Studio 中打开日志” 。
- 打开 “ScreenPlay”文件夹。
- 检查最新的
.html文件。
每个 HTML 文件都包含一个执行追踪,其中详细介绍了 ScreenPlay 智能体如何推理提示、识别用户界面目标以及执行每个操作的方式。此追踪可让您了解决策流程,并帮助验证 ScreenPlay 行为或对其进行故障排除。
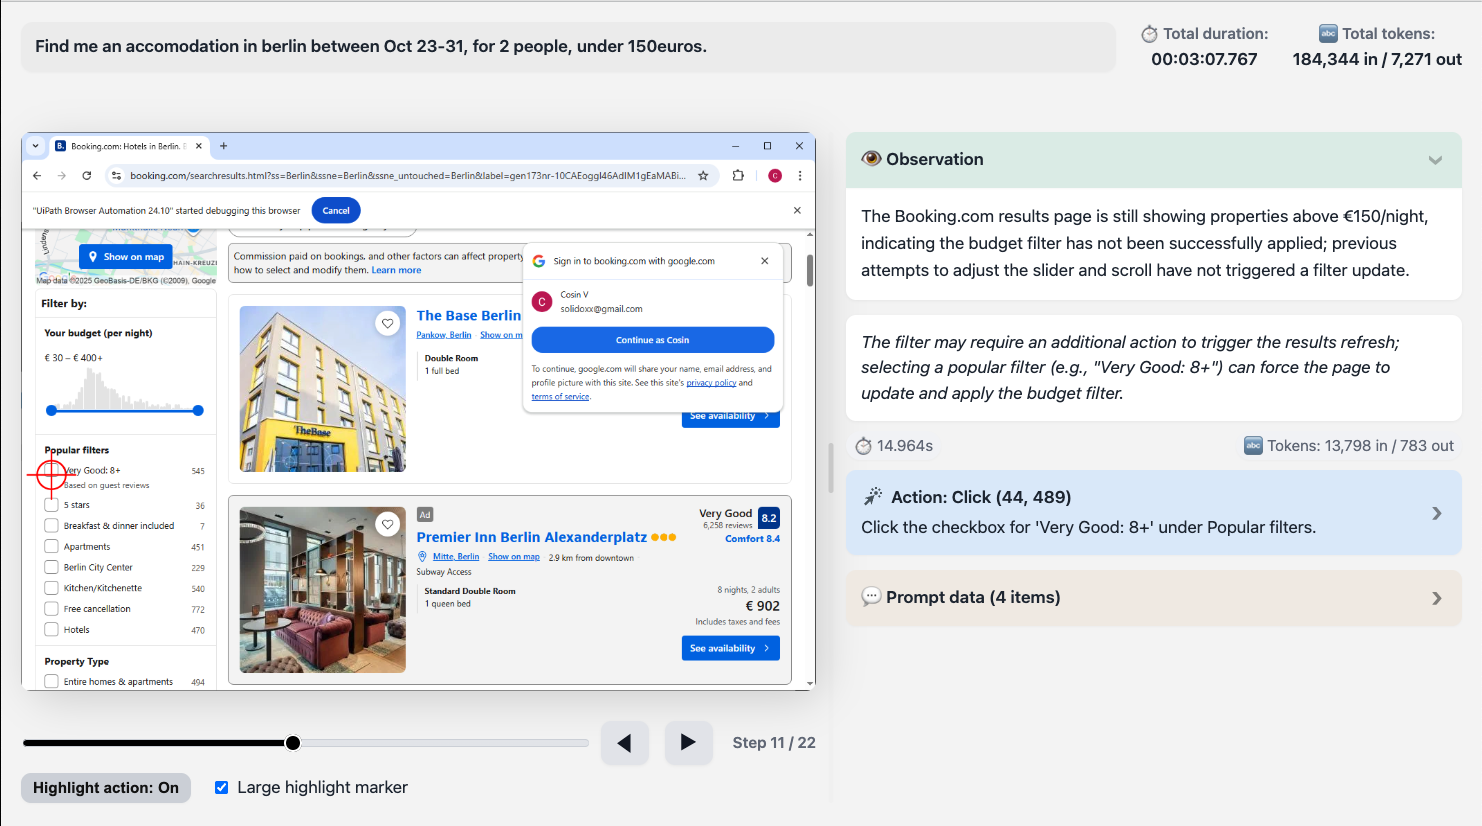
Screen Play 执行追踪 HTML 文件
Screen Play 执行追踪 HTML 文件提供 Screen Play 自动化运行的完整可视化和诊断记录。它以结构化的交互式格式捕获提示输入、AI 推理、屏幕上操作和时间指标。
您可以使用此文件来检查和验证ScreenPlay如何解释提示,将哪些用户界面元素作为目标,以及每个自动化步骤在界面上的执行方式。
默认情况下,该文件是自动生成的。您可以在“项目设置”中更改此设置,然后选择“新式用户界面自动化” ,然后转到ScreenPlay,您还可以在其中设置追踪文件的存储天数。

概述
当您运行ScreenPlay自动化时,执行追踪会自动生成.html文件。此文件结合以下内容:
- 自然语言提示数据。
- 带边框的分步用户界面快照。
- 时间和令牌指标。
- 用于推理和错误的诊断部分。
您可以在任何新式网页浏览器中打开 HTML 文件,以查看或共享完整的执行序列。
文件结构
每个ScreenPlay追踪文件都遵循一致的内部结构,包括以下顶级部分。
| 版块 | 描述 |
|---|---|
| 页眉 | 显示执行的提示词、追踪 ID 和时间戳。 |
| 总体指标(总计) | 汇总总运行时、处理时间和令牌使用情况。 |
| 播放器容器 | 包含可视化回放组件 — 屏幕截图、高亮显示和步骤导航。 |
| 迭代块 | 智能体推理或执行周期中的每次迭代(步骤)。包括屏幕截图、推理和指标。 |
| 诊断部分 | 用于 AI 推理、活动数据和错误消息的可选面板。 |
标头字段
下表描述了标头字段和示例:
| 字段 | 示例 | 描述 |
|---|---|---|
| Prompt | create a random RPA supplier | 启动自动化的自然语言指令。 |
| Trace ID | 3b97584d-7fc0-43f6-830b-fc45c21811b3 | 此执行追踪的唯一标识符,用于参考或比较。 |
总体指标
“总计”部分汇总了执行的关键性能数据。
下表描述了整体指标:
| 指标 | 描述 |
|---|---|
| 总持续时间 | 完成执行所需的总时间,包括感知、推理和操作阶段。 |
| 缓存/DOM/服务器/操作(工具提示) | 细分每个子系统(例如,缓存的响应、DOM 扫描、推理和用户界面操作)经过的时间。 |
| 令牌总数 | 如果追踪包含 AI 语言模型推理,则跟踪令牌输入/输出。用于调试 LLM 的使用情况。 |
步骤框架
每个步骤框架或执行步骤都代表 ScreenPlay 智能体的一次推理和操作迭代。
下表描述了每个元素及其用途。
| 元素 | 用途 |
|---|---|
| 步骤编号 (data-step="1") | 标识步骤的序列顺序。 |
| 屏幕截图 | 在执行时捕获的应用程序窗口或桌面图像。 |
| 画布坐标(数据坐标) | 用于检测到的元素或与之交互的元素的 JSON 编码边框。 |
| 迭代标头 | 显示步骤标题、推理预览和持续时间摘要。 |
| 迭代内容 | 包含展开的详细信息,包括推理文本和任何执行元数据。 |
诊断部分
每次迭代可能包含一个或多个可扩展部分,如下表所述:
| 版块名称 | 用途 |
|---|---|
| 想法 | 显示 AI 推理和意图解释(如果启用了推理)。 |
| 步骤信息 | 显示有关目标元素、选取器或检测到的用户界面控件的上下文信息。 |
| 错误 | 以红色视觉提示表示失败;包括错误消息、异常追踪或回退操作。 |
| 活动数据 | 显示结构化执行数据,包括活动类型、参数和目标应用程序。 |
屏幕截图查看器和播放器控件
ScreenPlay 追踪包含一个内置播放器,用于浏览每个捕获的帧。
下表介绍了每个控件。
| 控制 | 描述 |
|---|---|
| “下一步”/“上一步”按钮 | 在顺序步骤之间导航。 |
| 步长范围滑块 | 直接跳到序列中的某个步骤。 |
| 切换高亮显示 | 覆盖“数据坐标”字段中定义的边框,以可视化单击或输入的区域。 |
| 屏幕截图容器 | 如果没有可用的图像,则显示渲染的图像或占位符。 |
可视叠加层
每个步骤都可以包含叠加层以指示用户界面交互类型,如下所示:
- “单击”– 在按钮或可单击区域上绘制的矩形。
- 键入 – 在输入字段周围高亮显示。
- 悬停/拖动 – 显示移动情况或光标位置的边框。
- “错误标记” – 失败的元素操作覆盖红色。