- Getting Started
- Access and Permissions
- Installation and Upgrade
- Interacting with Insights
- Historical data export
- Logs
- Performance and Scalability
Insights user guide
Viewing dashboards
To view a dashboard in Insights, select the corresponding tile from the grid. The dashboard will open with any pre-configured filters, highlighted in the Filters section (located above the dashboard tiles).
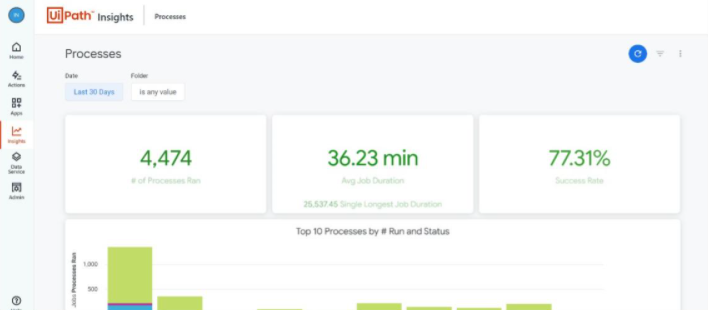
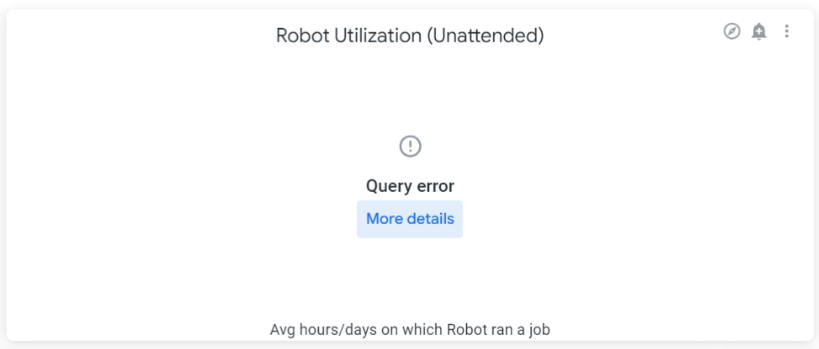
There is a five minute timeout period for all dashboard widgets in UiPath Insights. This is aimed at improving performance for all dashboards. However, some widgets might display a Query error message.
Creating new dashboards
To create a new dashboard, take the following steps:
-
Navigate to the Insights home page.
-
Select the Create New Dashboard button on the top-right corner of the page.

-
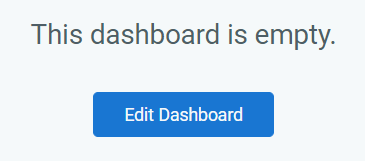
In the pop-up window, enter a name for the dashboard and select the Create button. You will be directed to a blank dashboard page with the following message and button:
 Note:
Note:You cannot create or edit a dashboard if you have Insights opened in two different browser tabs at the same time.
-
Select Edit Dashboard and then select Add Tile. You can now see a window asking you to choose an Explore. This means that you need to specify which of the entities you would like fields from (Jobs, queues, or robot logs). If you have ROI Editor permissions, you will also see the Process and Queue Manual Values Explores.
-
Select the Explore that corresponds to the fields you want to include in your dashboard. For example: Process Name is available under the Jobs explore, Queue Name is under the Queues explore, etc.
Note:If you pick the wrong explore and want to switch to another one, you need to select Cancel and start again.
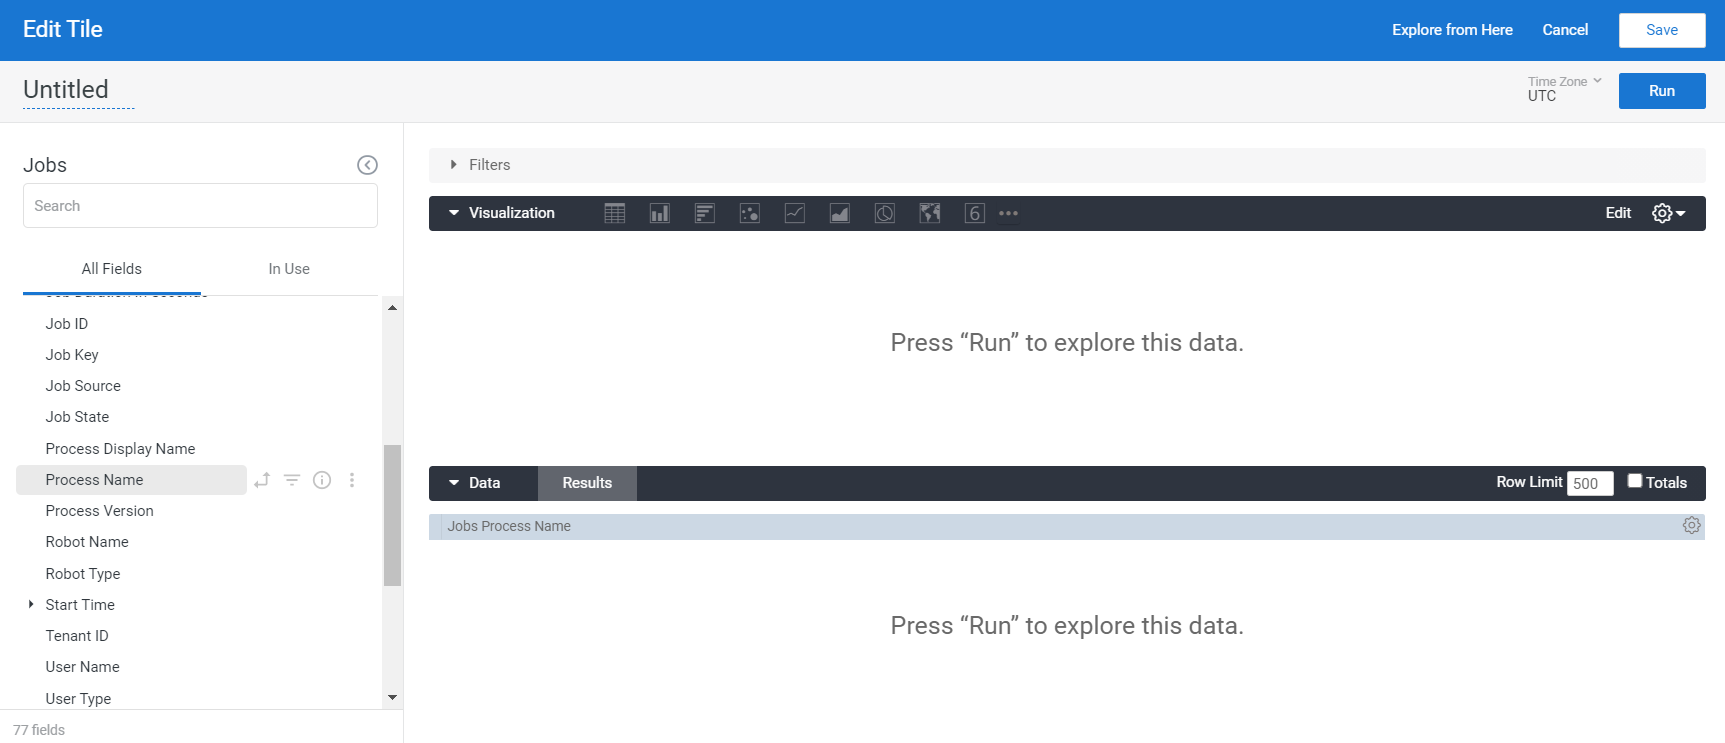
For detailed instructions on how to proceed next, we recommend reading Looker’s guides for creating dashboards.
The following pages help you create dashboards through the Looker UI:
- Creating User-Defined Dashboards: Creating dashboards and adding dashboard tiles.
- Editing User-Defined Dashboards: Editing dashboards; rearranging tiles, resizing tiles, editing dashboard tiles, adjusting dashboard settings; and deleting dashboards.
- Adding and Editing User-Defined Dashboard Filters: Adding, configuring, editing, and deleting dashboard filters.
- Cross-Filtering Dashboards: Enabling filters, creating filters, sharing dashboards, drilling into the data, and removing cross-filters.
- Using forecasting in visualizations: Create, display, and monitor forecasted results in visualizations.
Note:
Before switching between dark and light theme, you need to save all changes made to your dashboard.
Duplicating dashboards
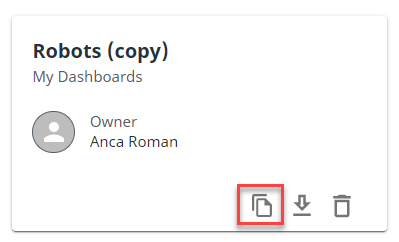
You can duplicate any dashboard in My Dashboards by selecting the Share/Duplicate button on the dashboard tile and selecting Duplicate.
A copy of the selected dashboard is created and appears in the My Dashboards section. This copy is completely separate and can be edited without any impact to the original dashboard.
Changing the dashboard time zones
Any user can select the time zone displayed in any dashboard. To update it, go to the dashboard's three-dot menu, select Each tile's time zone, and pick the desired time zone. The default dashboard time zone is the same as the one set for the respective tenant in Orchestrator. This will be accessible under the Viewer Time Zone option from the dropdown.
Dashboards created will default to this Viewer Time Zone, and this time zone will be maintained when a user selects Explore From Here on any dashboard. When adding or editing a tile in an existing dashboard, the tile will default to UTC.
Exploring data
When creating new tiles, you have the option to Explore from Here.
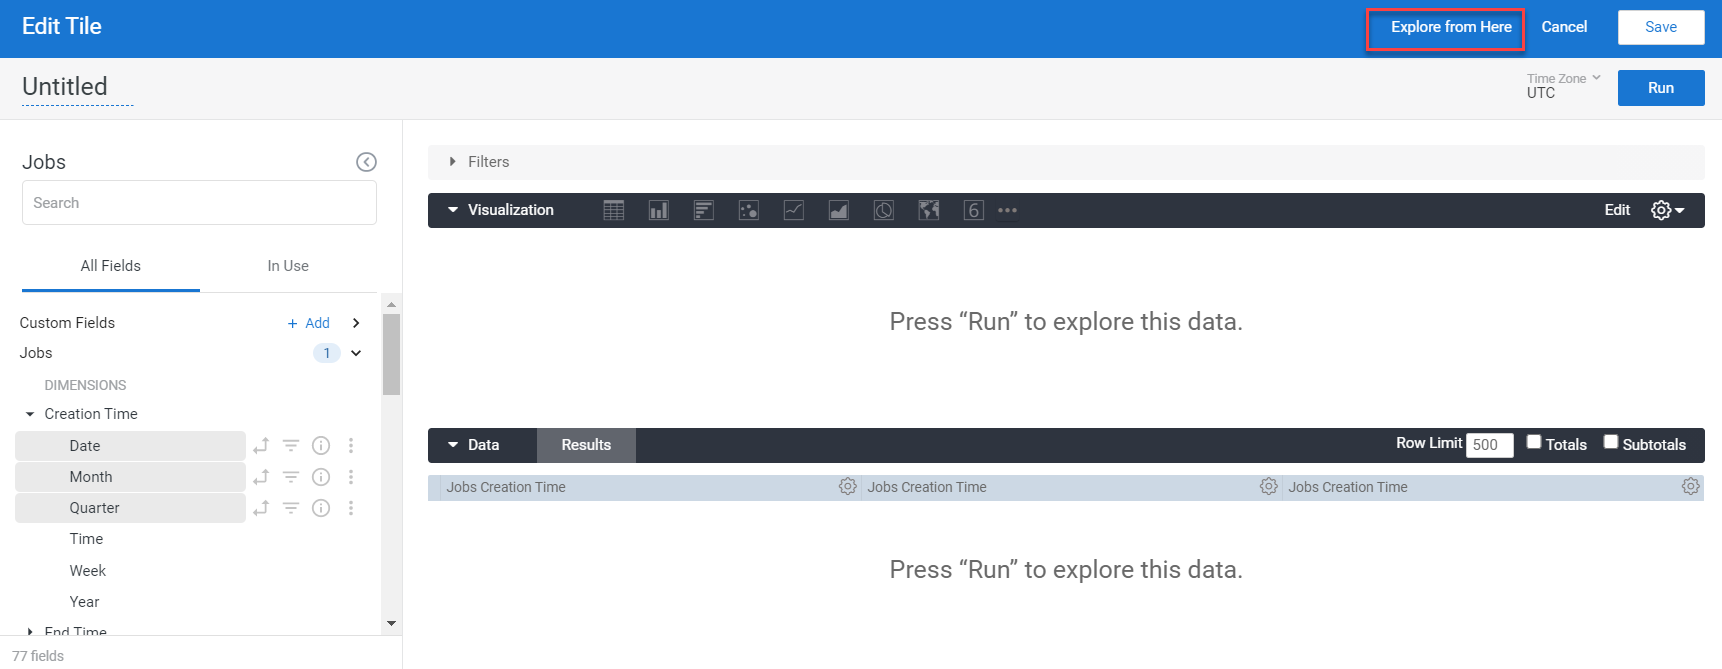
Selecting this button allows you to open a tile creation window with the existing data selection. This allows you to freely experiment with any tile edits without affecting your dashboard.
You can then save your new tile into a new dashboard, or save to an existing one by selecting the gear menu on the top-right corner of the explore, and then selecting Save to Dashboard. In the resulting window, select the Group folder to save to Tenant, and the Personal folder to save to My Dashboards.
Navigating between dashboards
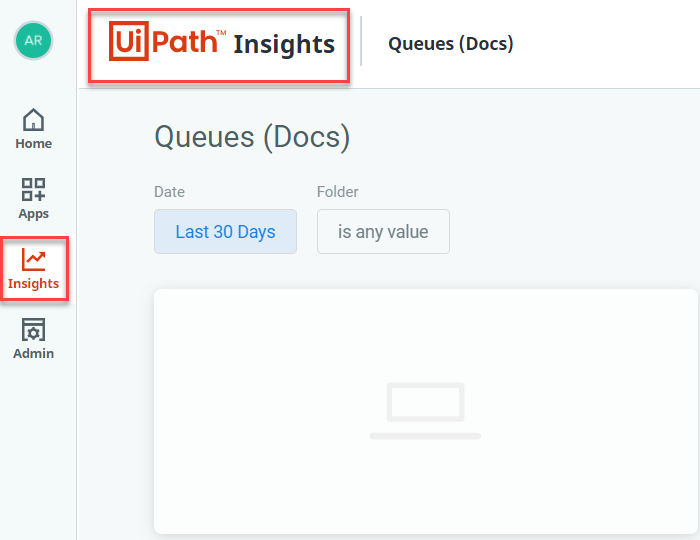
To switch between dashboards, you need to go back to the Insights home page, and then select the dashboard you are interested in. To get to the Insights home page when you are viewing a dashboard, you can either Select the Insights button on the left navigation menu, or select the UiPath or Insights logo on the top left of the page. You can also select "Dashboards" from the 3-dot action menu on the top right of the window.
Filtering dashboards
Insights supports creation of pre-defined filters, as well as cross-filtering via interaction with the dashboard. Pre-defined filters are created during the dashboard edit experience.
To create a pre-defined filter:
-
Navigate to your desired dashboard and open it in edit mode.
-
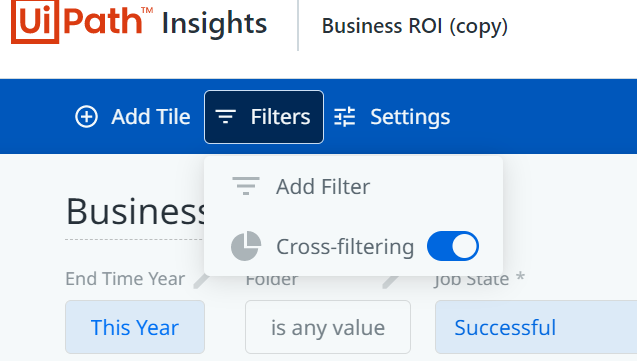
Select the filter button, and select the Add Filter option.
-
Search for the field you'd like to filter on, and select it.
-
Pick the filter type, provide a default value if desired, and select which tiles this filter should apply to under the Tiles to Update tab. If this is a dashboard-level filter, you will most likely want the filter to apply to all tiles on the dashboard.
To cross-filter a dashboard, make sure that cross filtering is enabled by toggling it "on" in the filter menu when editing a dashboard. Once you've saved the dashboard, or if you're interacting with any of the UiPath Templates, select items in widget tiles that you'd like to filter the dashboard by, and the selected criteria will appear to the right of your pre-defined filters at the top of the dashboard. You can repeat this for as many filters as you need. To remove a cross-filter, use the X button next to it.
Editing filters
-
To edit a pre-defined filter, open the dashboard in edit mode and follow the steps above to access the filter menu. Make sure you save the dashboard once you're done making the desired changes.
-
You can hide or show filters by selecting the Filter icon.
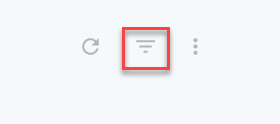
-
If you'd like to change the current value on a pre-defined filters, make your desired changes and then select the blue update button to the left of the Filter icon in order to update the dashboard with the latest selection.
-
Opening the three-dot menu to the right of the filter button displays the following options:
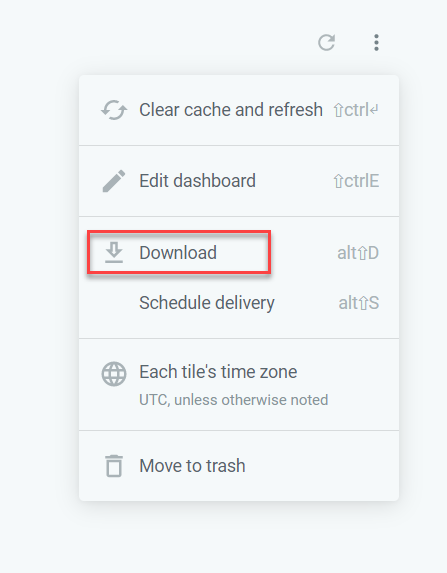
Option Description Clear cache and refresh Reloads the dashboard with the latest data from the database. Edit Dashboard Only available if this is a dashboard that you created. Download Downloads the dashboard in a format of choice (covered in the Exporting Dashboards section). Move to trash Deletes the dashboard. Only available if this is a dashboard that you created
Sharing dashboards with tenant
Tenant dashboards are available to all Insights users. However, only users with Designer permissions can contribute to them. Viewers can view all dashboards shared to Tenant but cannot share any there themselves.
To share a dashboard to Tenant, take the following steps:
- Navigate to the My Dashboards tab on the home page, and find the tile of the dashboard you want to share to Tenant. Select the Copy icon.
- From the resulting menu, select Share with Tenant. The dashboard will then appear in the Tenant tab with the user who shared it as the owner.
Note:
To make a local copy of a dashboard from Tenant back to My Dashboards for customizing, Designer users can use the Copy to My Dashboards icon.
Downloading dashboards
There are multiple approaches to downloading dashboards and various file formats to choose from, depending on your customization needs.
Standard dashboard download
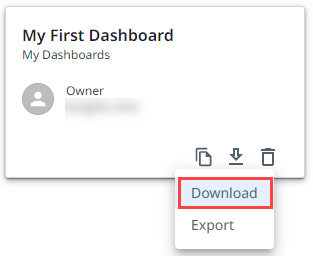
This option allows you to download a dashboard as a .pdf file with standard options. To do that, you need to select the Download or Export icon on any dashboard card and choose Download from the drop-down list.
Advanced dashboard download
This option provides you with additional configuration options and enables you to download dashboards either as a .pdf or a .csv file.
To do that, take the following steps:
-
Open the desired dashboard, select the three-dot menu in the top-right corner of the dashboard, and select Download.
-
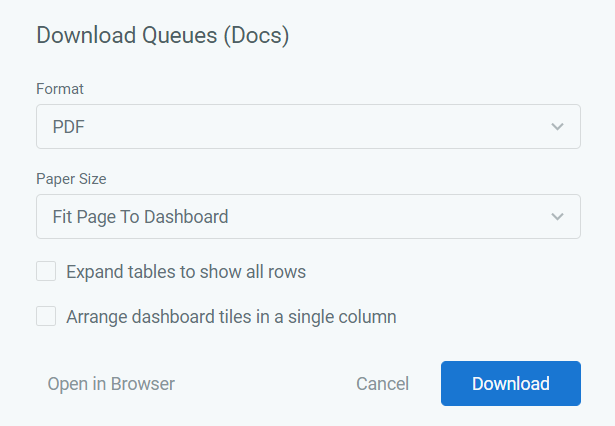
From the resulting popup, select the desired format (
.pdfor.csv), paper size, and check the styling options that suit your needs. -
Select the Download button when the configuration is complete.
Data download
You can also export data from individual widgets.
To do that, take the following steps:
-
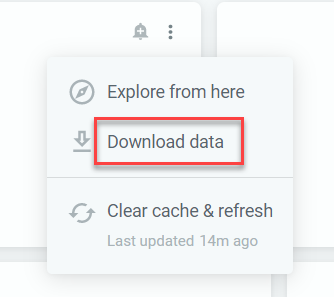
Select the three-dot menu next to any individual tile and select Download Data. A new window opens, allowing you to customize your download.
-
In the resulting window, choose the desired file format. The following options are available:
-
.txt(tab-separated values) -
Excel spreadsheet (Excel 2007 or later)
-
.csv -
.json -
.html -
Markdown
-
.png(image of visualization)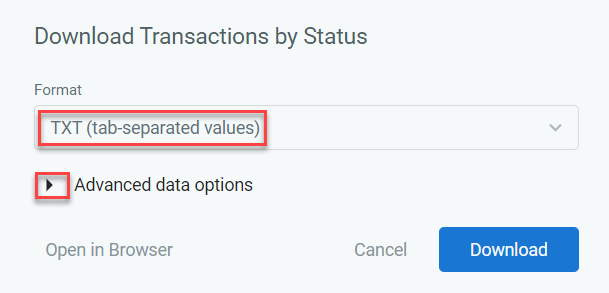
-
-
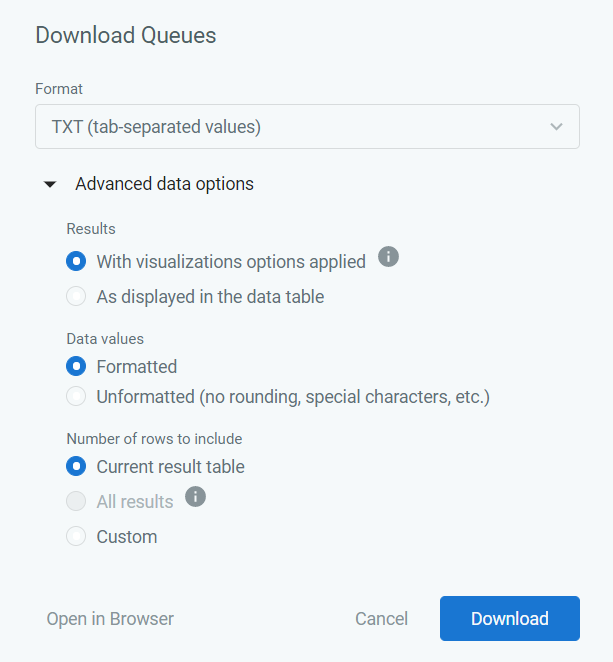
For more options, select the arrow next to Advanced data options.
-
In the Results section, choose whether you want visualization settings applied to your downloaded data.
- If you choose With visualization options applied, Insights applies some of the visualization settings to your download, causing your download to appear similar to a table chart. Any of the following settings in the Plot,Series, and Formatting menus that are configured for the visualization are applied to the downloaded data:
- Show Row Numbers
- Hide Totals
- Hide Row Totals
- Limit Displayed Rows to a maximum of 500 rows shown or hidden.
- Show Full Field Name
- Custom labels for each column (Looker uses field labels as its rendered value in its JSON output).
- Conditional Formatting for downloads of table chart visualizations in Excel format.
Important:
Conditional formatting will display in Excel deliveries of data downloads with the table chart visualizations only if the Along a scale Rule is applied.
- If you choose As displayed in the data table, visualization options are not applied, and the download appears like the data table in the Data section of the Explore.
- If you choose With visualization options applied, Insights applies some of the visualization settings to your download, causing your download to appear similar to a table chart. Any of the following settings in the Plot,Series, and Formatting menus that are configured for the visualization are applied to the downloaded data:
-
In the Values section, choose how you want the downloaded query results to appear:
- If you choose Unformatted, special formatting is not applied to your query results, such as rounding long numbers or adding special characters that may have been put in place.
- If you choose Formatted, the data appears more similar to the Explore experience in Insights.
-
You can choose how much data you want to download:
- Current results table: the number of rows specified by the row limit of your Explore.
- All Results: all results returned by the query.
- Custom: a custom number of rows.
Exporting and importing dashboards
You can export a dashboard and import it into the same tenant, a different tenant. The following dashboards can be exported:
- Dashboards that use the base Insights model (Jobs, Queues, and Robot Logs that come with the product).
- Personal dashboards from the My Dashboards and Tenant Dashboards tabs.
- Dashboards that use ROI, custom variables, and integration data.
Dashboards that don't fall into any of the previously mentioned categories don't have the option to be exported.
- To export a Dashboard, you must have the Designer role. For more information on roles, check the Granting Permissions page.
- Import / export isn't supported for custom variables or ROI.
Export dashboards
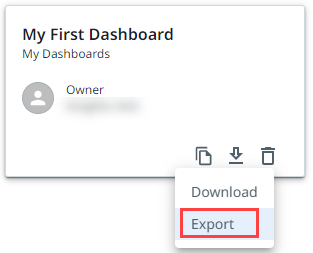
To export a dashboard, you need to select the Download icon on any dashboard card and select Export from the drop-down list.
The exported file is downloaded to the download location configured in your browser.
Import Dashboards
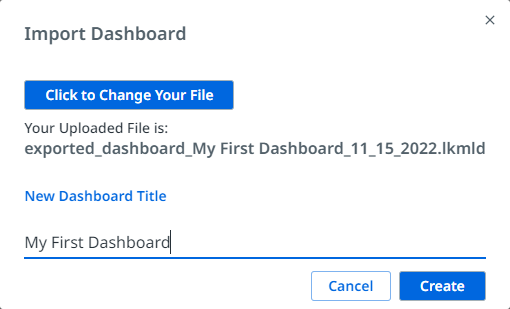
To import Dashboards, follow the steps below:
-
Navigate to the Insights home page.
-
Click the Create New Dashboard button on the top-right corner of the page and select Import Dashboard from the drop-down list.

-
Click Click to Upload Your File to select the Dashboard you want to import.
-
Insert a title for the new Dashboard.
-
Click Create.
Deleting Dashboards
You can delete dashboards individually using the Delete button on the dashboard tile. Alternatively, you can open a particular dashboard, select the three-dot menu in the top-right corner of the dashboard window, and select Move to trash.
If a dashboard is accidentally deleted, please reach out to UiPath Technical Support for assistance in recovering it.
To find out how to capture logs if needed to debug with the support team, check out Capturing logs page.
- Viewing dashboards
- Creating new dashboards
- Duplicating dashboards
- Changing the dashboard time zones
- Exploring data
- Navigating between dashboards
- Filtering dashboards
- Editing filters
- Sharing dashboards with tenant
- Downloading dashboards
- Standard dashboard download
- Advanced dashboard download
- Data download
- Exporting and importing dashboards
- Export dashboards
- Import Dashboards
- Deleting Dashboards