- Primeros pasos
- Instalación
- Instalación de ScreenPlay
- Mejores prácticas
- Recopilación de datos
- Ejecutar e inspeccionar los resultados de la ejecución
- Seguridad de la variable ScreenPlay

Guía del usuario de ScreenPlay
Ejecutar e inspeccionar los resultados de la ejecución
Después de configurar tu solicitud de ScreenPlay, sigue los siguientes pasos:
- Ejecuta la automatización en modo de depuración .
- Una vez completada la ejecución, puedes revisar cómo el agente interpretó y ejecutó tu solicitud:
- Ve a Depurar y luego selecciona Abrir registros en Studio.
- Abre la carpeta ScreenPlay.
- Inspecciona los archivos
.htmlmás recientes.
Cada archivo HTML contiene un seguimiento de ejecución que detalla cómo el agente de ScreenPlay razonó sobre la solicitud, identificó los objetivos de la IU y ejecutó cada acción. Este seguimiento proporciona visibilidad del proceso de toma de decisiones y ayuda a validar o solucionar problemas de comportamiento de ScreenPlay.
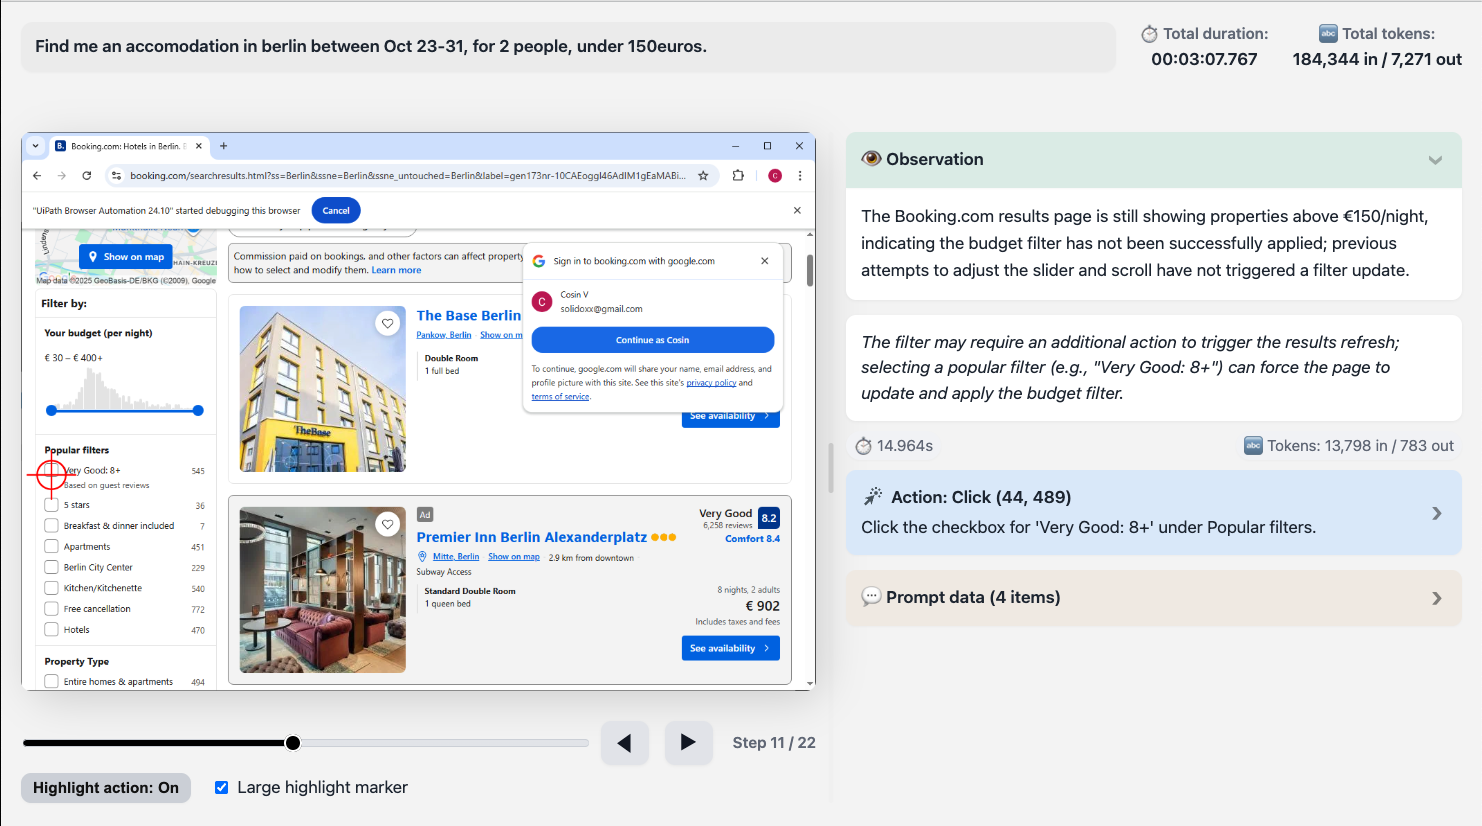
El archivo HTML de seguimiento de ejecución de ScreenPlay
El archivo HTML de seguimiento de ejecución de ScreenPlay proporciona un registro visual y de diagnóstico completo de una ejecución de automatización de ScreenPlay. Captura la entrada de solicitudes, el razonamiento de la IA, las acciones en pantalla y las métricas de tiempo en un formato estructurado e interactivo.
Puedes utilizar este archivo para inspeccionar y validar cómo ScreenPlay interpretó una solicitud, qué elementos de la interfaz de usuario se dirigieron y cómo se ejecutó cada paso de automatización en la interfaz.
El archivo se genera automáticamente de forma predeterminada. Puedes cambiar esta configuración en Configuración del proyecto, luego seleccionar UIAutomation Modern y luego ir a ScreenPlay, donde también puedes establecer el número de días durante los que se almacenan los archivos de seguimiento.

Información general
Cuando ejecutas una automatización de ScreenPlay, el seguimiento de la ejecución se genera automáticamente como un archivo .html . Este archivo combina:
- Datos de solicitud de lenguaje natural.
- Instantáneas de IU paso a paso con cuadros delimitadores.
- Métricas de tiempo y token.
- Secciones de diagnóstico para razonamiento y errores.
Puedes abrir el archivo HTML en cualquier navegador web moderno para revisar o compartir la secuencia de ejecución completa.
Estructura del archivo
Cada archivo de seguimiento de ScreenPlay sigue una estructura interna coherente con las siguientes secciones de nivel superior.
| Sección | Descripción |
|---|---|
| Encabezado | Muestra la solicitud, el ID de seguimiento y la marca de tiempo de la ejecución. |
| Métricas generales (totales generales) | Resume el tiempo de ejecución total, los tiempos de procesamiento y el uso de tokens. |
| Contenedor de reproductor | Contiene el componente de reproducción visual: capturas de pantalla, destacados y navegación por pasos. |
| Bloques de iteración | Cada iteración (paso) en el ciclo de razonamiento o ejecución del agente. Incluye capturas de pantalla, razonamiento y métricas. |
| Secciones de diagnóstico | Paneles opcionales para razonamiento de IA, datos de actividad y mensajes de error. |
Campos de encabezado
Las siguientes tablas describen los campos de encabezado y ejemplos:
| Campo | Ejemplo | Descripción |
|---|---|---|
| Prompt | create a random RPA supplier | La instrucción de lenguaje natural que inició la automatización. |
| Trace ID | 3b97584d-7fc0-43f6-830b-fc45c21811b3 | Un identificador único para este seguimiento de ejecución, utilizado como referencia o comparación. |
Métricas generales
La sección Grandes totales resume los datos clave de rendimiento de la ejecución.
La siguiente tabla describe las métricas generales:
| Métrica | Descripción |
|---|---|
| Duración total | El tiempo total necesario para completar la ejecución, incluidas las fases de percepción, razonamiento y acción. |
| Caché/DOM/Servidor/Acciones (información sobre herramientas) | Desglose del tiempo transcurrido en cada subsistema (por ejemplo, respuestas en caché, escaneo DOM, razonamiento y acciones de IU). |
| Tokens totales | Realiza un seguimiento de la entrada/salida del token si el seguimiento incluye el razonamiento del modelo de lenguaje de IA. Útil para depurar el uso de LLM. |
Paso de fotogramas
Cada cuadro de pasos, o paso de ejecución, representa una iteración de razonamiento y acción por parte del agente ScreenPlay.
La siguiente tabla describe cada elemento y su propósito.
| Elemento | Propósito |
|---|---|
| Número de paso (data-step="1") | Identifica el orden de secuencia del paso. |
| Captura de pantalla | Una imagen capturada de la ventana de la aplicación o del escritorio en el momento de la ejecución. |
| Coordenadas del lienzo (data-coordinates) | Cuadros delimitadores codificados en JSON para elementos detectados o interactuados. |
| Encabezado de iteración | Muestra el título del paso, la vista previa del razonamiento y el resumen de la duración. |
| Contenido de iteración | Contiene detalles ampliados, incluido el texto de razonamiento y cualquier metadato de ejecución. |
Secciones de diagnóstico
Cada iteración puede incluir una o más secciones ampliables, como se describe en la siguiente tabla:
| Nombre de sección | Propósito |
|---|---|
| Pensando | Muestra el razonamiento de IA y la interpretación de intenciones (si el razonamiento está habilitado). |
| Información del paso | Muestra información contextual sobre el elemento de destino, selector o control de IU detectado. |
| Error | Indica un fallo, con señales visuales en rojo; incluye mensajes de error, seguimientos de excepciones o acciones alternativas. |
| Datos de actividad | Muestra datos de ejecución estructurados, incluido el tipo de actividad, los argumentos y las aplicaciones de destino. |
Visor de capturas de pantalla y controles del reproductor
Los seguimientos de ScreenPlay incluyen un reproductor integrado para navegar por cada fotograma capturado.
La siguiente tabla describe cada control.
| Control | Descripción |
|---|---|
| Botones Siguiente/Anterior | Navega entre los pasos secuenciales. |
| Control deslizante de rango de pasos | Salta directamente a un paso de la secuencia. |
| Alternar destacados | Superponga los cuadros delimitadores definidos en el campo de coordenadas de datos para visualizar las áreas en las que se ha hecho clic o se han escrito. |
| Contenedor de capturas de pantalla | Muestra la imagen renderizada o el marcador de posición si no hay ninguna imagen disponible. |
Superposiciones visuales
Cada paso puede incluir superposiciones para indicar los tipos de interacción de la IU, de la siguiente manera:
- Clic: rectángulo dibujado sobre un botón o área en la que se puede hacer clic.
- Tipo: resalta alrededor de los campos de entrada.
- Mantener el puntero/arrastrar: contorno que muestra el movimiento o la posición del cursor.
- Marcador de error: superposición roja en una acción de elemento fallida.