insights
2023.10
false
- Getting Started
- Access and Permissions
- Interacting with Insights
- Automation Hub Integration
- Historical data export
- Logs
- Performance and Scalability
- Real-time data export
Insights user guide
Last updated May 7, 2026
Overview
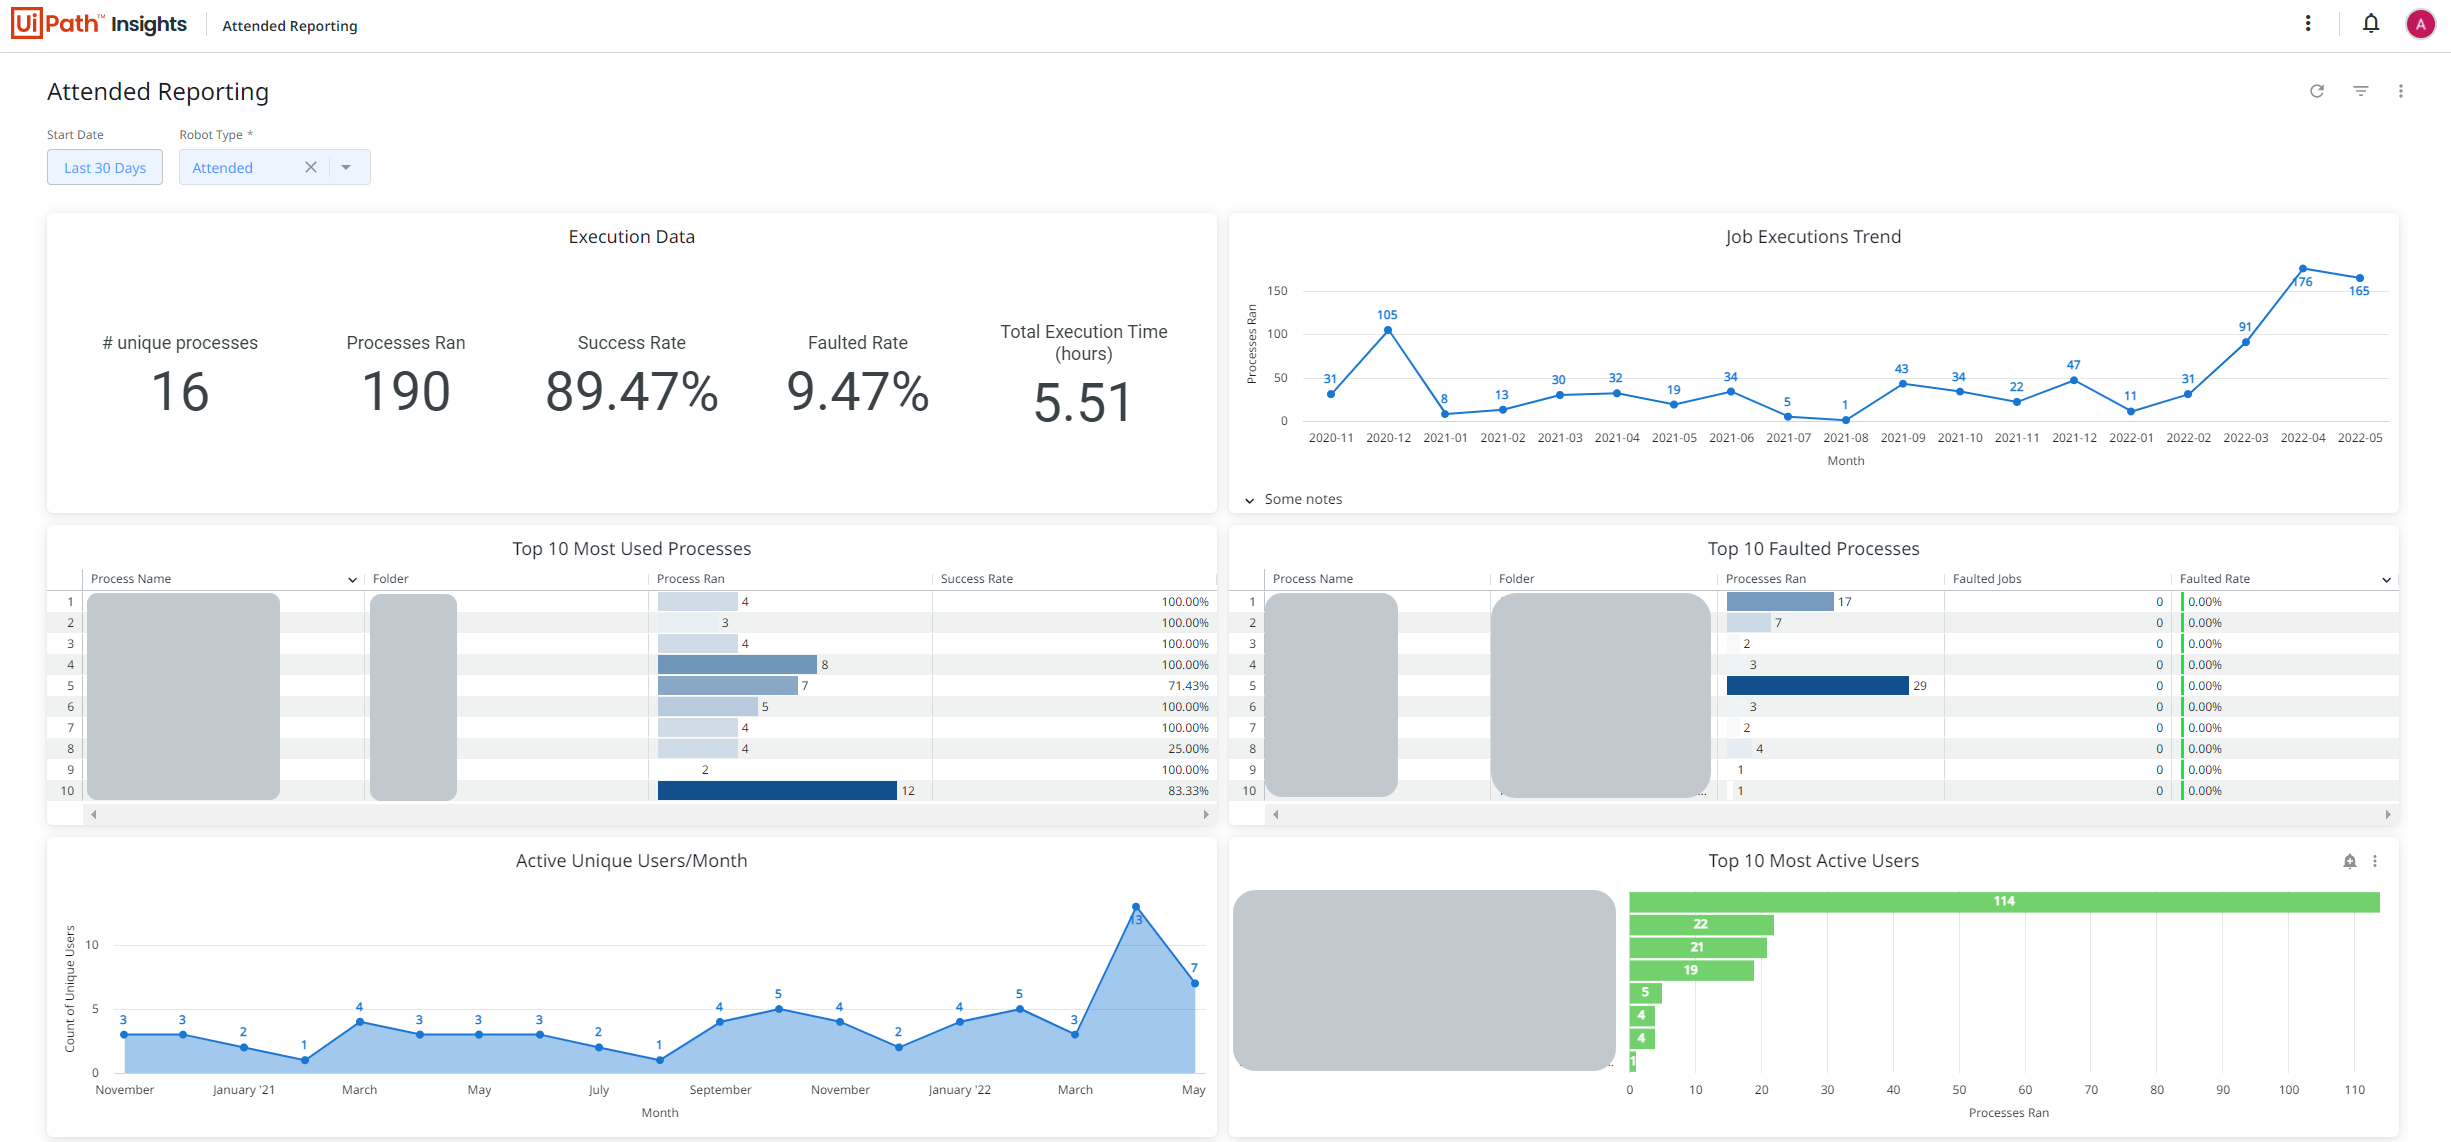
The Attended Reporting template displays an overview of your attended robot workforce. You can use this template to stay on top of usage and get a pulse on how your RPA program is doing.

Metrics
| Tile | Metrics | Description |
|---|---|---|
| Execution Data |
| Metrics that help you understand the overall health of your attended RPA program. |
| Jobs Executions Trend | Processes Ran by time | Explore the job execution trendline. |
| Top 10 Most Used Processes |
| Track what processes have been used most often. |
| Top 10 Faulted Processes |
| Keep track of processes with high error rates. |
| Active Unique Users/Month | Count of Unique Users by time | See the number of active Attended users for each month. |
| Top 10 Most Active Users | Processes Ran by User Name | Track which members of your attended team are most active. |
| Top 10 Rarely Used Processes | Processes Ran by Processes Name | View processes that are used the least, and so might be least impactful. |
| Top 10 Least Active Users | Processes Ran by User Name | Get information about the least active users to redistribute licenses or provide more training if needed. |
| Executions from Studio |
| Check job executions directly from Studio. These cannot be seen in Orchestrator, only Insights. |
Working with the Attended Reporting Template
See this blog post written by the Insights product team to dive more into each metric and how to take action based on the values.