# Process graphs
> A Process graph gives insight into how the steps of a process relate to each other and shows all possible paths that cases take through the process.
## Introduction
A Process graph gives insight into how the steps of a process relate to each other and shows all possible paths that cases take through the process.
To generate a Process graph, at least the `Case ID`, `Activity` and `Event end` attributes must be available.
The Process graph uses this information to trace the events of each case and construct a graph of the process.
## Creating a process graph
Follow these steps to create a Process graph.
| Step | Action |
| --- | --- |
| 1 | Got to the **Dashboards** tab and create a new dashboard on an event-based table. |
| 2 | Right click in the dashboard item list and select **New process graph** and then the events based table. |
| 3 | Go to the **Process graph** tab. |
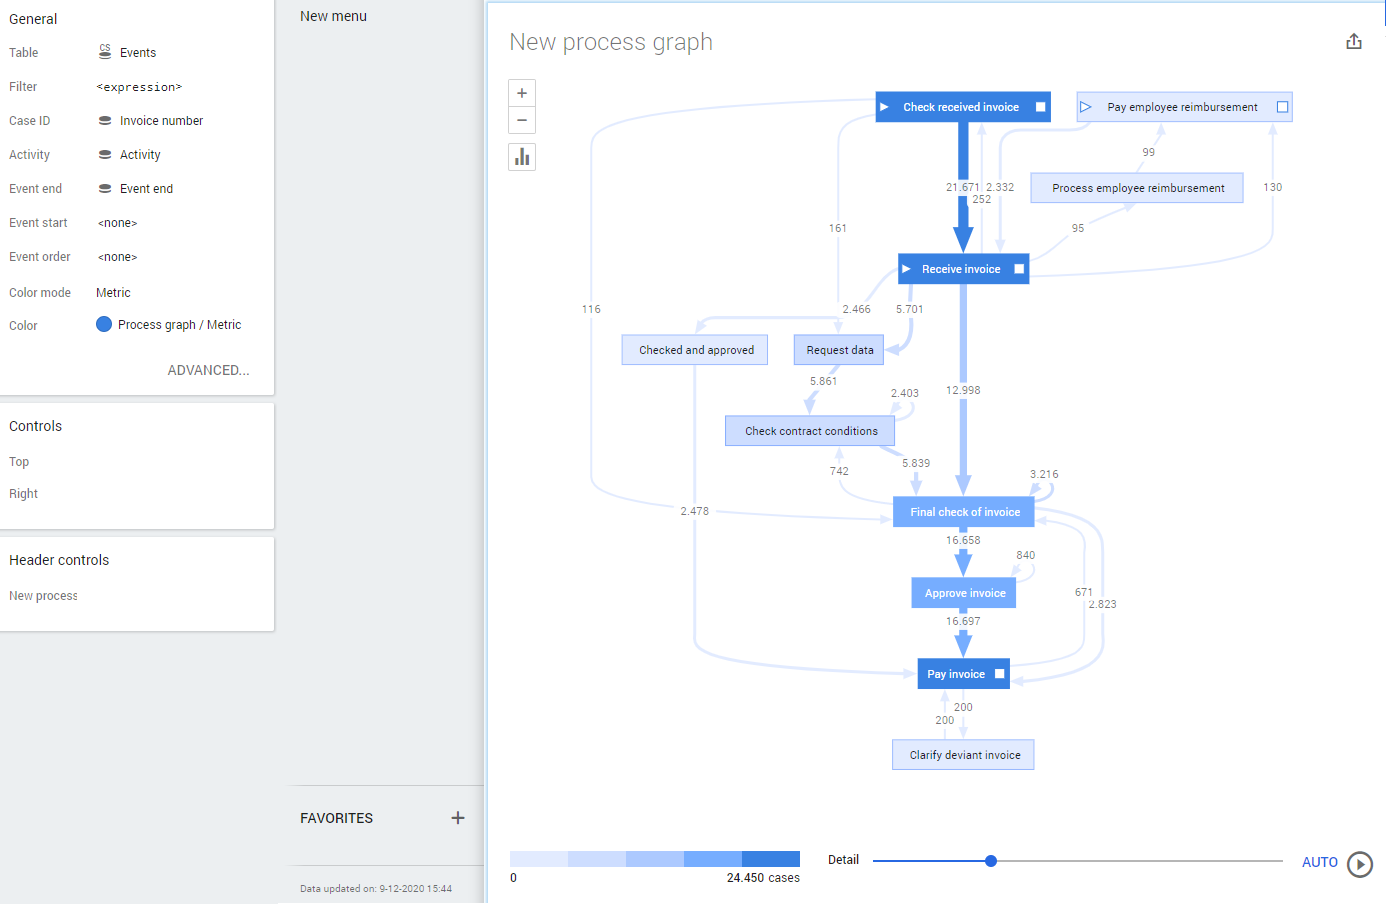
| 4 | Drag the attribute representing the Case ID, for example Invoice number, to **Case ID** in the **General** panel. |
| 5 | Drag the attribute representing the Activity, to **Activity** in the **General** panel. |
| 6 | Drag the attribute representing the Event end to **Event end** in the **General** panel. |
See illustration below for an example.
### Process graph tab
The **Process graph** tab displays the properties of a selected Process graph. In the **General** panel you can enter the properties that define the Process graph. See illustration below.
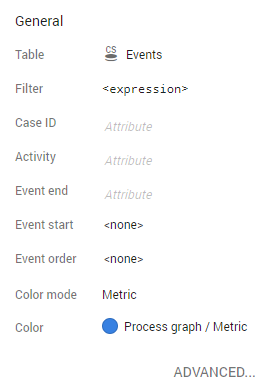
Below is a description of the properties in the **General** panel.
Property
Description
Table
The table on which the Process graph is based. This table contains the attributes that are displayed in the Process graph.
Filter
Enables you to enter an expression that returns a Boolean value to filter data from the table before it is provided to the Process graph. Note: The syntax of the expression should be similar to a per record expression. See Record Expressions .
Case ID
Enables you to select the attribute that is a (unique) identifier for each case. Note: This is a mandatory property for the Process graph.
Activity
Enables you to select the attribute that represents the activities that comprise the process. Note: This is a mandatory property for the Process graph.
Event end
Enables you to select the attribute that defines the end time for each event. Note: This is a mandatory property for the Process graph.
Event start
Enables you to select the attribute that defines the start time for each event.
Event order
Enables you to select the attribute that defines the order of the events. See Event order
Color mode
Enables you to select the color map to be used for the Process graph.
Color
Enables you to select a different color for the Process graph. See Changing the Process graph colors
ADVANCED...
Displays the Advanced Process Graph Settings dialog.
### Timestamps
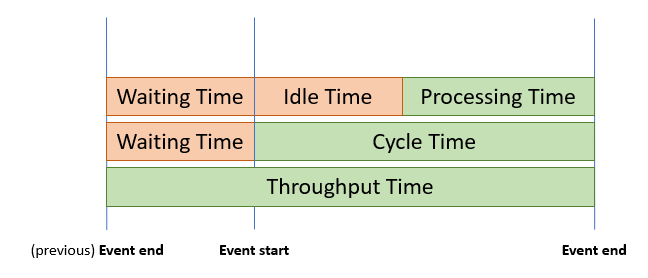
The duration of the event is taken as the time between two **event end** timestamps that follow each other. In this case, events will have no waiting time. The graph will show the *throughput time* of events. Each transition shows the throughput between the two activities, while each activity shows the average throughput time of all incoming transitions.
When both and **Event start** and **Event end** are defined, the duration of the event is known. In this case, the graph will show *cycle time*. Note that in this case the transitions in the graph always show the same value as their target activity, the waiting time is not taken into account.
### Event order
By default, events are ordered by **Event end**. If the attribute **Event start** is set, and there are multiple events with the same **Event end**, it will be used to solve ties.
It is also possible to define **Event order**. When Event order is set, and the ties cannot be solved by **Event end** or **Event start**, the events will be ordered according to the specified attribute.
### Changing the process graph colors
When a new Process graph is created, the default color is used. It is possible to use a different color scheme in the Process graph to differentiate between values.
Follow these steps to change the color of the Process graph.
| Step | Action |
| --- | --- |
| 1 | Click on the Process graph and go to the **Process Graph** tab. |
| 2 | Click on **Color** icon next to **Color** in the **General** panel. |
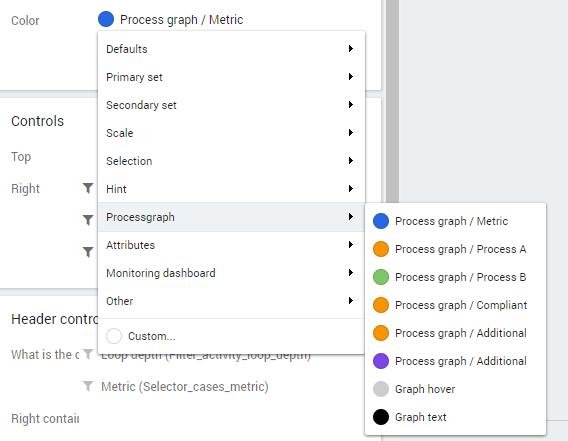
| 3 | Select a color from the predefined colors list. See illustration below. You can also click on **Custom...** to select a new color from the color picker. |
:::note
If you select a different **Color mode**, for example **Compare** to create a Process graph that can be used to compare two different process models, or **Reference** to create a Process graph that can be used to verify the current process model against one or more reference models, you can also select the colors to indicate the differences between the compared models.
:::
### Color mode
The Color mode defines the color map to be used for the Process graph. This enables you to create different types of Process graphs, for example for comparing process models. Below is a description of the different color modes.
Color mode
Description
Metric
Displays the Process graph with a metric based color map. Note: Metric is the default color mode.
Activity
Enables you to use a custom color attribute to display the activities.
Highlight
Enables you to define a subset of cases that are highlighted with the rest of the graph shown as context in the background.
Compare
Enables you to define two process models, both displayed with different colors.
Reference
Enables you to select a set of reference models where you can define different colors for the cases conforming to the reference model and for additional cases.
## Process graph animation
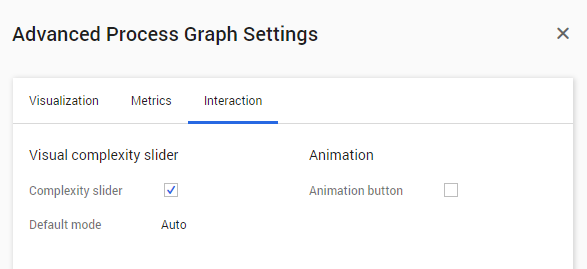
By default, when you create a Process graph the Animation button is visible. This button enables end users to start the Process graph animation. You can remove the Animation button in the Advanced Process Graph Settings.
Follow these steps to remove the Animation button from the Process graph.
| Step | Action |
| --- | --- |
| 1 | Click on the Process graph and go to the **Process Graph** tab. |
| 2 | Click on **ADVANCED...** in the **General** panel. |
| 3 | Go to the **Animation** section on the **Interaction** tab. |
| 4 | Disable the **Animation button** check box. See illustration below. |
| 5 | Click on **OK**. |