# Simulating automation potential
> The **Automation potential** dashboard enables you to see potential savings for activities in your process. For example, if you determine an activity as a bottleneck in the process graph, you can calculate the impact of automating the activity. From the **Automation potential** dashboard you can simulate various What-if scenarios to identify which activities are most costly and how much time or money possibly could be saved when automating one or more activities.
## Introduction
The **Automation potential** dashboard enables you to see potential savings for activities in your process. For example, if you determine an activity as a bottleneck in the process graph, you can calculate the impact of automating the activity. From the **Automation potential** dashboard you can simulate various What-if scenarios to identify which activities are most costly and how much time or money possibly could be saved when automating one or more activities.
### Providing data input using dbt seeds
You can provide input data to be used for the calculations in the **Automation potential** dashboard using a *dbt* seed file. The seeds\ folder of the app transformations for app templates contain a Automation_estimates_raw.csv file. For all activities, you can provide the Event_processing_time (in milliseconds) and the Event_cost. See the illustration below for an example.

## Automation potential
The **Automation potential** charts highlight the simulated activities with the highest simulated automation rate.
:::note
If there are no (more) simulated activities, activities with the lowest activity rate are displayed. These activities are selected as the activities that are candidates for automation based on their automation potential.
:::
For each activity, the **Automation rate**, and the **Manual processing time** are displayed.

The **Modify simulation** button on an activity chart enables you to modify the parameter values for the existing simulation.
:::note
If you have not set any simulation parameters for the activity, you can select the **Configure simulation** button on the activity chart to open the **Modify simulation** panel where you can change the simulation parameters.
:::
### KPIs
The following table describes the **KPIs** that are displayed at the top **Automation potential** dashboard.
KPI
Description
Automation rate
Percentage of events that are automated.
Manual processing time
The total amount of time that is actually spent working on the events.
Manual processing cost
The total costs spent on the events. Note: Manual processing cost is only displayed if the event_cost field is available in your dataset.
FTE
The total time that is needed to perform the work for events. FTE is calculated by dividing the manual processing time in hours by the number of working hours. The number of working hours is calculated from the number of working days in the selected period * 8 working hours per day.
Number of events
The total number of events.
### Green and red arrows
The effects of the simulated scenario are indicated by **green** or **red** arrows. If the simulation results in an increased automation potential compared to the actual situation, this is indicated with **green** arrows. If the simulation results in a lower automation potential, this is indicated with **red** arrows. In the above example, with **Withdraw purchase order**, the activity actually is 0% automated. The simulation calculated a potential 58.4% automation rate. Since, the difference is a 58.4% increase, a green arrow is displayed indicating a positive outcome. The simulated manual processing time is 14.11 days. Based off a 58.4% automation rate the simulated manual processing time dropped with 19.8 days. **Create purchase order** is 90.3% automated. The simulation calculated a potential 58.4% automation rate. Since, the difference is a 31.91% decrease, a red arrow is displayed. Based off a 58.4% automation rate the simulated manual processing time increased 5.66 hr to 23.38 hr.
### Automation rate
The **Automation rate** is calculated from the events for which the `automated` field is set to `true`.
### Manual processing time
The manual processing time is the total amount of time that is actually spent working on the events.
If the event_processing_time is not provided using the Automation_estimates_raw.csv seeds file, the **Automation potential** simulation calculates the **Manual processing time** from the event data that is available in your dataset. In this case, the **Manual processing time** is the *cycle time* between the `Event start` and the `Event end`.
:::note
If the event_processing_time is provided using the Automation_estimates_raw.csv seeds file, but not filled in for all activities, the **Manual processing time** for the remaining activities is NULL by default. Consider using the average throughput time as the event_processing_time for these activities.
:::
If for at least one event the `Event start` is not available, the **Automation potential** simulation will display the *throughput time* between the `Event end` and the previous `Event end` as the **Manual processing time**.
| Duration | Description |
| --- | --- |
| Cycle time | The time between the `Event start` and the `Event end`. The actual time worked on an event. |
| Throughput time | The time between the `Event end` and the previous `Event end`. |

## All automation opportunities
The **All automation opportunities** chart displays the activities based on the current **Automation rate**, which is determined by the percentage of events that are automated. The activities with the lowest automation rate are displayed first.

The following table contains a description of the elements.
Element
Description
Activity
The name of the activity.
Automation rate
The percentage of events that are automated.
Manual processing time
The total amount of time that is actually spent working on the events.
Manual processing cost
The total costs spent on the events. Note: Manual processing cost is only displayed if the event_cost field is available in your dataset.
FTE
The total time that is needed to perform the work for events. FTE is calculated by dividing the manual processing time in hours by the number of working hours. The number of working hours is calculated from the number of working days in the selected period * 8 working hours per day.
Simulate
A toggle button that displays the results of the simulation. If you have not performed a simulation for the action, the Modify simulation panel is displayed, where you can enter different values to use for calculating the automation potential.
Enables you to open a context menu with the following options:
Modify simulation : displays the Modify simulation panel where you can enter different values to use for calculating the automation potential.
Send to Automation Hub : displays the Send to Automation Hub form, which enables you to submit an idea for automation. Check out Sending automation ideas to UiPath Automation Hub .
:::note
In the **Automation potential** dashboard, the **Compare** button is disabled. **Compare** mode is not available when simulating automation potential.
:::
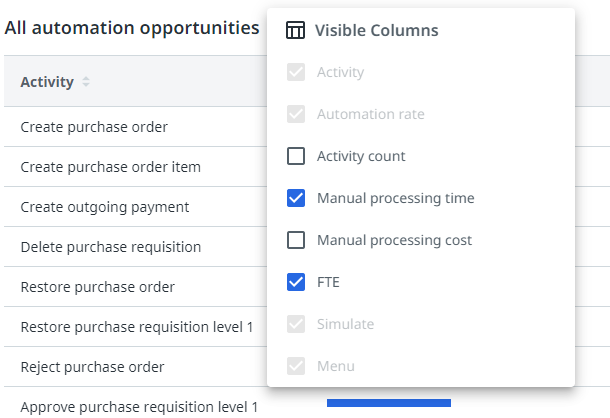
### Selecting visible columns
Follow these steps to change the visible columns.
1. Select the  **Columns** icon to display the list of columns.
2. Select the columns you want to display in the selected **All automation opportunities** chart.
:::note
The **Activity**, **Automation rate**, **Simulate,** and **Menu** columns cannot be hidden.
:::
## Displaying the Modify simulation panel
Follow these steps to display the **Modify simulation** panel.
1. Select **Automation potential** in the menu on the left of the dashboard.
2. Locate the activity for which you want to perform a simulation.
3. Select  in the **Actions** column of the activity, and select **Modify simulation** from the context menu.
The **Modify simulation** form is displayed to the right.

You can also click on the **Simulate** or **Modify simulation** button on an activity in the Automation potential chart, to display the **Modify simulation** panel.
### Simulation parameters
This simulation parameters are used to determine how much of the activity can be successfully automated.The following table describes the parameters that can be set to perform an automation potential simulation.
| **Context** | **Parameter** | **Description** |
| --- | --- | --- |
| Process ways of working | Number of ways to complete the process | The number of different variations possible in which the process or activity can be completed. |
| Data input | % of digital input | A percentage value that indicates how much of the input is digital. |
| Data input | % of structured digital input | A percentage range that indicates how much of the digital input is structured. |
If all the input data is structured and digital and if there is only one way to complete the process, then the process is 100% automatable. If the Automation potential is 90%, this indicates that 90% of the activity or process can be automated.
For a detailed description on how these parameters are used to perform an automation potential simulation check out the **Automation Potential** section on the [Detailed Assessment Algorithm](https://docs.uipath.com/automation-hub/automation-suite/2023.10/user-guide/information-about-the-detailed-assessment-algorithm) page.
## Performing an Automation potential simulation
Follow these steps to perform an automation potential simulation to calculate the automation potential.
1. Select the applicable option from the **Number of ways to complete the process** drop-down list to indicate the number of ways possible to complete the activity.
2. Enter a percentage value to indicate how much of the input is digital input in the **% of digital input** field.
The **% of digital input** is a mandatory field.
3. Select a percentage range from the **% of structured digital data input** drop-down list to indicate how much of the digital input is structured.
4. Click on **Save**.
The impact on the automation rate, the manual processing time, and the FTE for the activity is displayed in the **Automation potential** dashboard. Next to the current **Automation rate**, the **Automation rate** calculated from the simulation is displayed, as well as the difference percentage. For the **Manual processing time** and the **FTE** the difference between the current value and the simulated value is displayed.
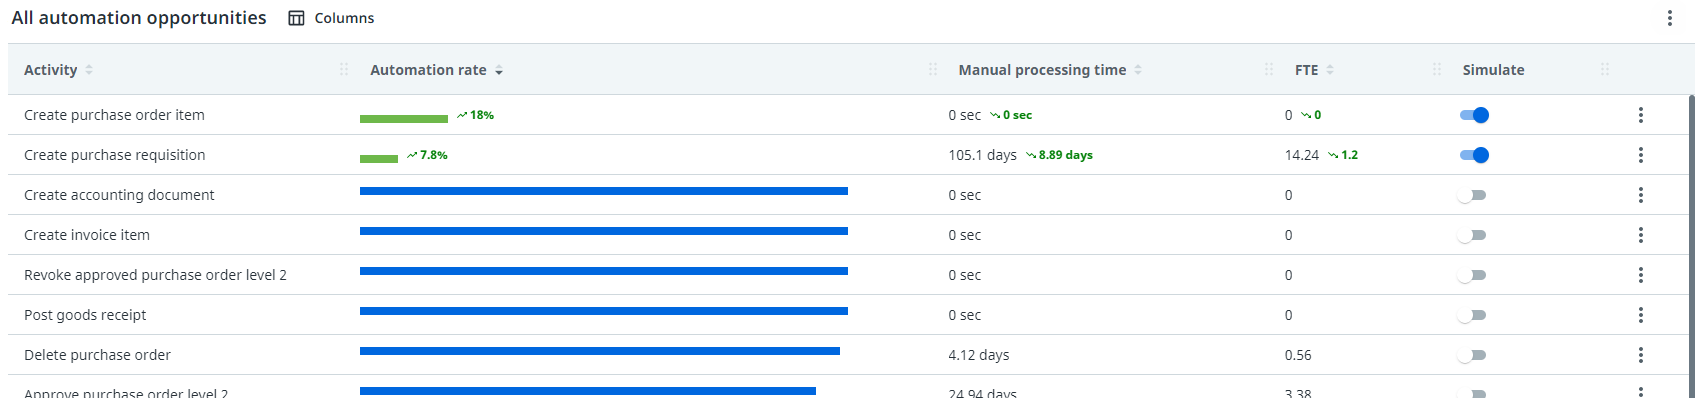
The automation simulations are saved. When you reopen the **Automation potential** dashboard, all active simulations are displayed.