# Processes
> The **Processes** page provides real-time monitoring and metrics of pending, active, and completed jobs in the current folder of your Orchestrator instance.
The **Processes** page provides real-time monitoring and metrics of pending, active, and completed jobs in the current folder of your Orchestrator instance.
## General View
Displays information about all the existing jobs on an aggregate basis, and it allows you to check the overall health of the jobs in your system. On this page, you can isolate data per environment so that you can quickly act in the event of an error. You can also control the granularity of the displayed data, to have a more accurate overview of how your jobs are getting executed in time.
:::note
* A job executing a long-running process is counted as one, regardless of being fragmented or executed by different Robots.
* A job that is started within a time interval and that is completed within the next is counted in both intervals in the relevant
graphs.
:::
### Filters
* **Include Subfolders** - enables you to select if the contents of all subfolders are included.
* **Interval** - enables you to control the granularity of the data, and display either the last hour or hour, last day (last 24 hours) hours), last week (last 7 days) or last month (last 30 days) of your Robots activity.
:::note
Filtering impacts all widgets, unless specified otherwise in the dedicated section.
:::
### Processes Overview
Enables you to check the status of your jobs and associated processes in real time so you can assess if there are any problems that can impact the entire system. Each color block represents a specific process from your instance. Hovering over a block displays the name of the corresponding process and its containing folder. Note that it is possible to have multiple processes with the same name if each is in a different folder.The total number of processes is displayed in parentheses after the widget name.
Processes are represented with colored blocks as follows:
Color
Tooltip
Green
The process was executed successfully. Note: If the job was executed successfully at least once, the block keeps its green color regardless of the failed executions.
Blue
The process is currently being executed.
Orange
Waiting for a Robot to connect. The process is suspended.
Red
The process was executed with errors. Note: The block keeps its red color if all the associated process executions fail. If the job is successfully executed at least once, the block changes to green.
Grey
The process that was never executed.
As a job's state changes, the chart gets updated and the block color changes accordingly. Hovering over a block displays detailed information on the corresponding process. Selecting the block displays the corresponding detailed view page. Select the arrow at the top-left of the page to return to the general view.
### Triggered Jobs States
Allows you to see the number of jobs currently being executed, awaiting execution, or being stopped so you can assess the efficiency of your system. As a job is either started or stopped, the chart gets updated accordingly. If the long-running workflows functionality is enabled, the widget also displays metrics on suspended and resumed jobs.
Figure 1. Triggered Jobs States
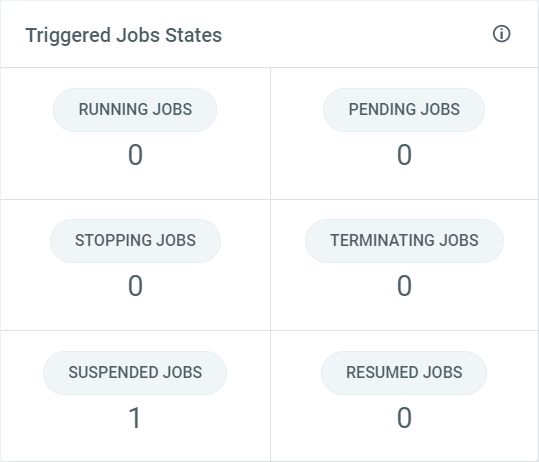
Filtering by **Interval** does not impact this widget.
### Running Jobs Timeframe
Allows you to see running jobs in the selected interval broken down into specific timeframes. Starting a new job results in a job number increase for the past hour. Please note that jobs started within schedules are taken into account as well.
### Completed Jobs Timeline
Allows you to see the jobs timeline in the selected interval broken down according to their final state. It enables you to have an overview of the number of jobs finished or stopped. Stopping a job causes the corresponding information here to update accordingly. **As long as a job is not yet finished, it is not taken into account in this widget.**
[Job states](https://docs.uipath.com/orchestrator/automation-suite/2023.10/user-guide/job-states) are represented with colors as follows:
| Color | Tooltip |
| --- | --- |
| Green | Successful |
| Orange | Stopped |
| Red | Faulted |
Select a marker in the chart to see the exact corresponding value. You can filter out states by selecting the labels below the chart.
### Completed Jobs Overview
Allows you to see precise figures of the final job states. Enables you to see if there are many jobs that are either faulted or stopped and implicitly make sure that the system is healthy. Starting or stopping a job causes the corresponding information from this widget to update accordingly. As long as a job is not yet finished, it is not taken into account in this widget.
[Job states](https://docs.uipath.com/orchestrator/automation-suite/2023.10/user-guide/job-states) are represented with colors as follows:
| Color | Tooltip |
| --- | --- |
| Green | Successful |
| Orange | Stopped |
| Red | Faulted |
The number in the middle of the chart represents the total number of jobs as illustrated by this widget. The number on each slice represents the transactions in that specific state. You can filter out states by selecting the labels below the chart.
### Upcoming Jobs
Allows you to see information pertaining to pending jobs. By applying the proper filters you can have an overview of the system load by checking the scheduled executions and the environments they are about to run on. The total number of Robots is displayed in parentheses after the widget name.
Field
Description
Process
The name of the upcoming process. Click the arrows at the right of the column name:
once to sort data by process name, in ascending alphabetical order;
twice to sort data by process name, in descending alphabetical order.
Runs
The number of scheduled executions for the corresponding process. Click the arrows at the right of the column name:
once to sort data by the number of executions, in ascending order;
twice to sort data by the number of executions, in descending order.
Search
Enables you to search by process name or environment.
Filtering by **Interval** does not impact this widget.
### Running Jobs
Allows you to see information pertaining to jobs that are currently running in case you want to assess which processes are being executed currently and how many times. The total number of distinct processes being executed is displayed in parentheses after the widget name. Starting or stopping a job causes the corresponding information here to update accordingly.
Field
Description
Process
The name of the executed process. Click the arrows at the right of the column name:
once to sort data by process name, in ascending alphabetical order;
twice to sort data by process name, in descending alphabetical order.
Runs
The number of ongoing executions for the corresponding process. Click the arrows at the right of the column name:
once to sort data by the number of executions, in ascending order;
twice to sort data by the number of executions, in descending order.
Search
Enables you to search by process name or environment.
Figure 2. Running Jobs
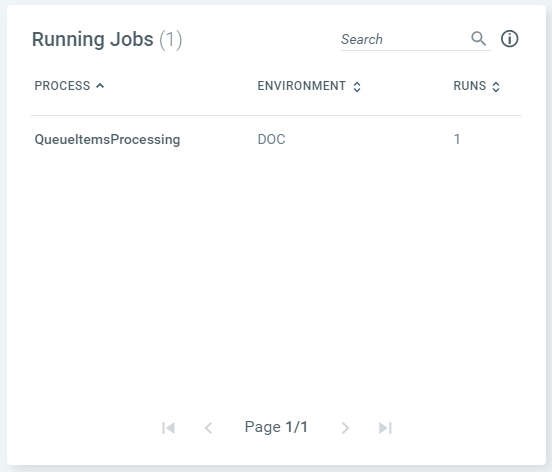
Filtering by **Interval** does not impact this widget.
### Processes Details
Allows you to see information pertaining to each process and the corresponding jobs metrics. If a Robot starts executing a new job, the corresponding information updates accordingly. The total number of processes is displayed in parentheses after the widget name.
Field
Description
Process
The name of the process. Click the arrows at the right of the column name:
once to sort data by process name, in ascending alphabetical order;
twice to sort data by process name, in descending alphabetical order.
Running
The number of running jobs the process is associated with.
Pending
The number of pending jobs the process is associated with.
Suspended
The number of suspended jobs the process is associated with. Only displayed if the long-running workflows functionality is enabled.
Resumed
The number of resumed jobs the process is associated with. Only displayed if the long-running workflows functionality is enabled.
Successful
The number of successful jobs the process is associated with.
Stopped
The number of stopped jobs the process is associated with.
Faulted
The number of faulted jobs the process is associated with.
Avg. Duration
The estimated duration of the job, based on previous executions, regardless of the final states. If there are no previous executions, N/A is displayed. The duration is displayed as a rounded-up value. The exact duration in ISO8601 format is shown when you hover over the displayed value.
Avg. Pending Time
The estimated time a job remained in a pending state, before getting executed, based on previous pending times, if any. If there are no previous instances in which the job remained in a pending state, N/A is displayed. The estimate is displayed as a rounded-up value. The exact duration in ISO8601 format is shown when you hover over the displayed value.
Search
Enables you to search by process and environment names.
## Individual View
Displays information concerning one process, as selected by the user from the general view, specifically on the **Processes Overview** widget.
### Filters
**Interval** - allows you to control the granularity of the data, and display either the last hour or last day (last 24 hours) of the selected Robot's activity.
### Triggered Jobs States
Allows you see the number of jobs associated to the selected process, that are currently being executed, awaiting execution, or being stopped. As a job is either started or stopped, the chart gets updated accordingly.
Figure 3. Triggered Jobs States

Filtering by **Interval** does not impact this widget.
### Completed Jobs Overview
Allows you to see precise figures of the final job states for the selected process. Enables you to see if there are many jobs for a specific process, that are either faulted or stopped. Starting or stopping a job causes the corresponding information here to update accordingly.
[Job states](https://docs.uipath.com/orchestrator/automation-suite/2023.10/user-guide/job-states) are represented with colors as follows:
| Color | Tooltip |
| --- | --- |
| Green | Successful |
| Orange | Stopped |
| Red | Faulted |
The number in the middle of the chart represents the total number of jobs as illustrated by this widget. The number on each slice represents the transactions in that specific state. You can filter out states by clicking the labels below the chart.
### Error Feed
Allows you to see the a list of the errors encountered for the failed jobs associated to the selected process. The errors are displayed in reverse chronological order as they occur, meaning a new error is always displayed at the top of the feed. The number of errors displayed in parentheses after the widget name is expressed according to your position within the feed and to the total number of errors. Let's say there are 453 errors in your feed. The following behavior is encountered:
| Position Within the Feed | Displayed Value |
| --- | --- |
| Between 0 and 99 | **99+** |
| Between 100 and 199 | **199+** |
| Between 200 and 299 | **299+** |
| Between 300 and 399 | **399+** |
| Further than 400 | The total number of errors in the feed, in this particular example **453**. |
After reaching the end of the feed, the total number of errors is displayed regardless of your position.
You can dismiss an error after having acknowledged it, however please take into account that multiple users might check the feed simultaneously, so we recommend carefully using the **Dismiss** button. A dismissed error is still taken into account in the error counter. After an error was dismissed, the name of the user who performed the action is displayed adjacently in a tooltip. Note that you need **Edit** permissions on Monitoring to dismiss errors.
| Field | Description |
| --- | --- |
| **Time** | The time when the error occurred. |
| **Error Message** | The actual error message. |
| **Dismiss** | Enables you to dismiss the specific error message. Clicking the **Dismiss** button removes the formatting from the text. A dismissed error is still taken into account in the error counter. After an error was dismissed, the name of the user who performed the action is displayed adjacently. Note that you need **Edit** Permissions on Monitoring in order to dismiss errors. |
| **Copy** | Enables you to copy the text of the error message to the clipboard. |
### Completed Jobs Timeline
Allows you to see the jobs timeline for the selected process in the selected interval broken down according to their final state. It enables you to have an overview of the number of jobs finished or stopped for that process. Starting or stopping a job causes the corresponding information here to update accordingly.
[Job states](https://docs.uipath.com/orchestrator/automation-suite/2023.10/user-guide/job-states) are represented with colors as follows:
| Color | Tooltip |
| --- | --- |
| Green | Successful |
| Orange | Stopped |
| Red | Faulted |
Select a marker in the chart to see the exact corresponding value. You can filter out states by selecting the labels below the chart.
### Jobs Details
Allows you to see information pertaining to each finished execution of the process and the corresponding metrics. If a Robot starts executing a new job, a new entry is added in the widget. Newest entries are displayed at the top. The status, the name of the executed process and the name of the queue, if any, are updated accordingly.
Field
Description
Robot
The name of the Robot that executed the job. Click the arrows at the right of the column name:
once to sort data by Robot name, in ascending alphabetical order;
twice to sort data by Robot name, in descending alphabetical order.
Machine
The name of the machine. Click the arrows at the right of the column name:
once to sort data by machine name, in ascending alphabetical order;
twice to sort data by machine name, in descending alphabetical order.
Items Processed
The number of queue items that have been processed during execution, if any.
Queue
The name of the queue whose items have been processed, if any.
States
The state of the job. This column is populated the same way as the Completed Jobs Overview widget.
Created
The time when the job has been created.
Started
The time when the job has been started. Click the arrows at the right of the column name:
once to sort data by the starting time, in ascending chronological order;
twice to sort data by the ending time, in descending chronological order.
Ended
The time when the job has ended.
Duration
The duration of the job. The duration is displayed as a rounded-up value. The exact duration in ISO8601 format is shown when you hover over the displayed value.
Search
Enables you to search by Robot or machine name.