# Forecasting
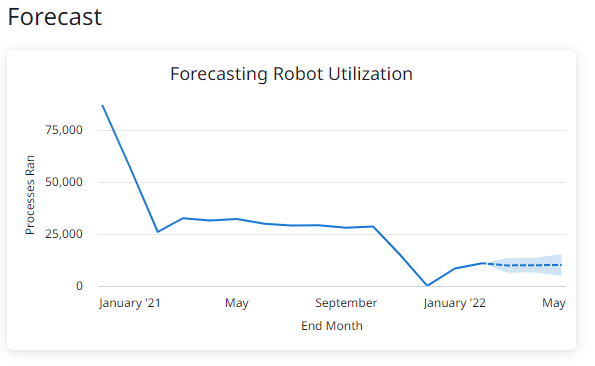
> You can use forecasting to predict the outcome of your business and operational data points. For example, you can see whether a trend goes upwards or downwards when it comes to Robot utilization in the following image.
## Overview
You can use forecasting to predict the outcome of your business and operational data points. For example, you can see whether a trend goes upwards or downwards when it comes to Robot utilization in the following image.
## How it works
Forecasting uses the AutoRegressive Integrated Moving Average (ARIMA) algorithm to predict how your data results are going to change over time.
## When to use forecasting
* Predict and monitor business impact, including time and money saved over time.
* To indicate the direction of a measure in a defined timeline (e.g., Robot utilization, Job success rate, Money saved, Time saved).
## Creating a forecast
To create a forecast, you need to configure the Explore to include timeframe dimensions and then add default or custom measures. In this example, we cover forecasting Robot utilization, or how the number of running processes will change over time.
For this example, the following fields are used:
* **Dimension**:**Jobs** > **End Date** > **Month**
* **Measures**:**Processes Ran**
Step 1: [Create Dashboard and configure Explore](https://docs.uipath.com/insights/automation-cloud/latest/user-guide/forecasting#forecasting)
Step 2: [Configure forecasting settings](https://docs.uipath.com/insights/automation-cloud/latest/user-guide/forecasting#configure-forecasting-settings)
### Create Dashboard and configure Explore
1. Open Insights in Automation CloudTM.
2. Use an existing dashboard or [create a new one](https://docs.uipath.com/insights/automation-cloud/latest/user-guide/dashboards#creating-new-dashboards). In this example, you can create a new tile.
3. Navigate to **Edit Dashboard** > **Add Tile**
4. Select the **Jobs** Explore.
5. Search for the following variables or navigate using the left-hand sidebar.
* **Dimension**:**Jobs** > **End Date** > **Month**
* **Measures**:**Processes Ran**
6. Set a filter for the **Jobs End Month** Dimension to capture a timeframe (e.g., up until the beginning of the month) For this example, we set the filter with the following conditions:
* **is before**
* **(absolute)**
* **March 1**
7. Select **Run** to run the query and trigger the visualization.
### Configure forecasting settings
:::note
Make sure that your Explore meets the following conditions:
* Include exactly one timeframe dimensions (with dimension fill enabled).
* Include at least one default or custom measure.
* Forecasts can include up to five default or custom measures.
* Filter results by the timeframe dimensions in descending order (e.g., last three months).
* Make sure that [the visualization that you are trying to build meets the query requirements](https://docs.looker.com/exploring-data/visualizing-query-results/forecasting-in-visualizations#explore_query_requirements_for_forecasting).
:::
After you create and run your query, go to the **Visualization** tab to select a measure by which the forecast is going to be done.
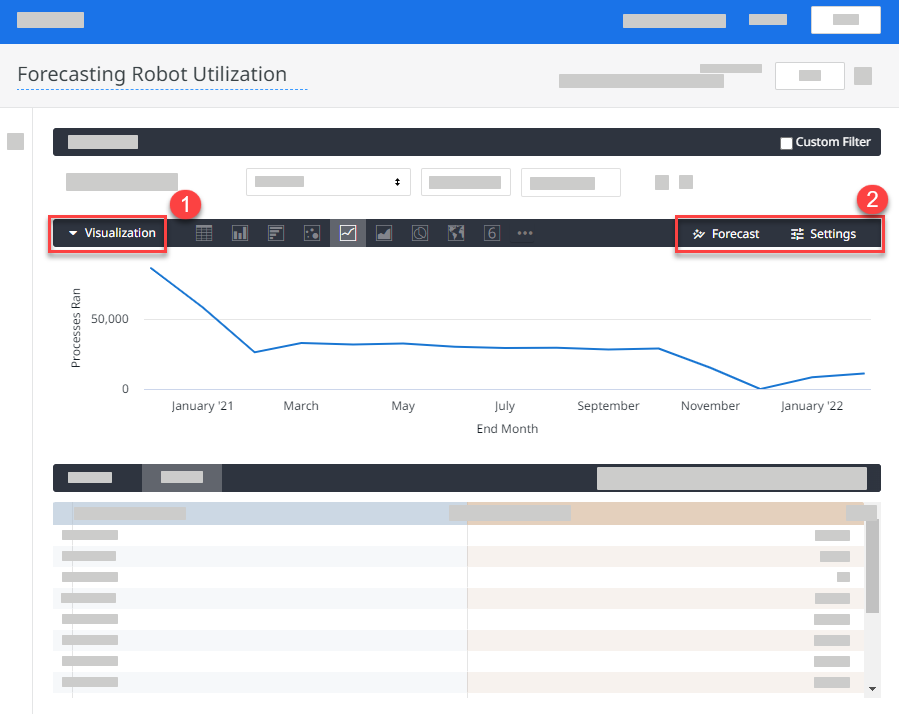
1. Select **Forecast** and then add a measurement field. For this example, only **Processes Ran** will show up as this is the field that has been added to the Explore. You can add up to five measurement fields to the forecast.
2. Set the **Length** of the forecast by entering a time period in months (e.g., 3 months).
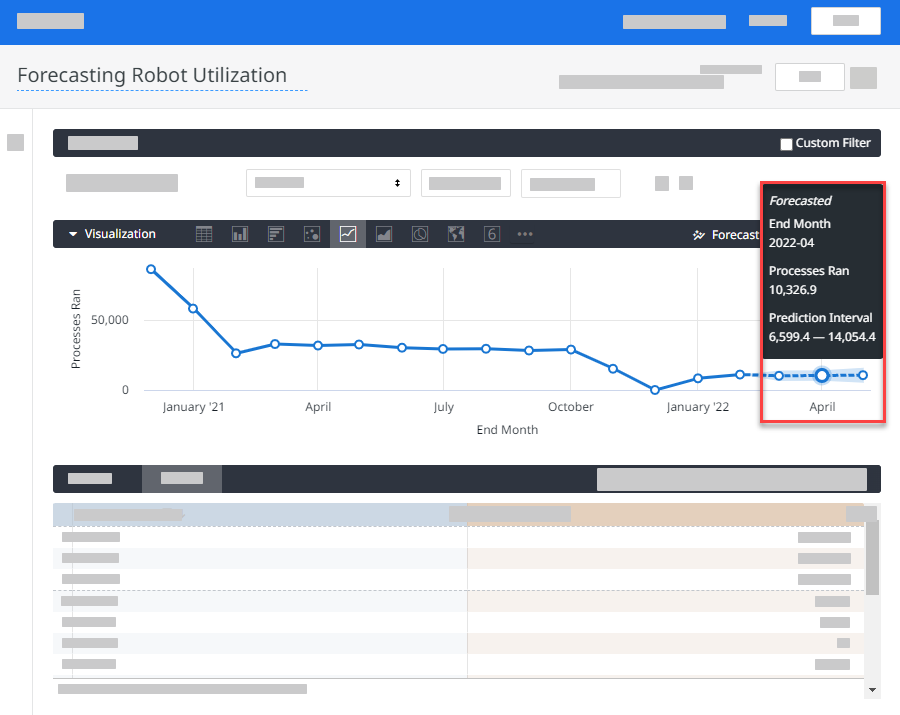
3. Set the **Prediction Interval**. The default value is set to 95%. The prediction interval shows you how accurate the estimation is going to be. Using the default value means that it is 95% likely that the future value (e.g., Processes Ran) will fall between the upper and lower bounds of the forecast.
4. Configure the **Seasonality** to account for predictable data variations that make up a cycle in the forecast. Use this option if you can account for known or yet-to-be-seen patterns in the data. Otherwise, it might lead to inaccurate estimates.
* **Automatic**: Detect any variation in the data set automatically.
* **Custom**: Specify the number of rows that make up a cycle for your data.
* **None**: Use this if there is no predictable cycles in the data.
5. (Optional) Select **Settings** to configure the look and feel of the forecast, such as plot styles, grid lines, trendline style, axis details and fonts.
6. Select **Run** to run the query and trigger the visualization.
7. Save the forecast as a new dashboard.
## Edit Forecast
1. Open Insights in Automation CloudTM.
2. Navigate to your forecast dashboard.
3. Select the three-dot menu in the top-right corner of the dashboard and select **Edit dashboard**.
4. Select the three-dot menu in the top-right corner of the tile and select **Edit**.
5. Navigate to **Visualization** > **Forecast** to change forecasting settings. Make sure that your updated [Explore meets the forecast requirements](https://docs.uipath.com/insights/automation-cloud/latest/user-guide/forecasting#configure-forecasting-settings).
6. Select **Run** to run the query and trigger the visualization.
7. Save the forecast as an updated dashboard.
## Remove Forecast
1. Open Insights in Automation CloudTM.
2. Navigate to your forecast dashboard.
3. Select the three-dot menu in the top-right corner of the dashboard and select **Edit dashboard**.
4. Click the three-dot menu in the top-right corner of the tile and select **Edit**.
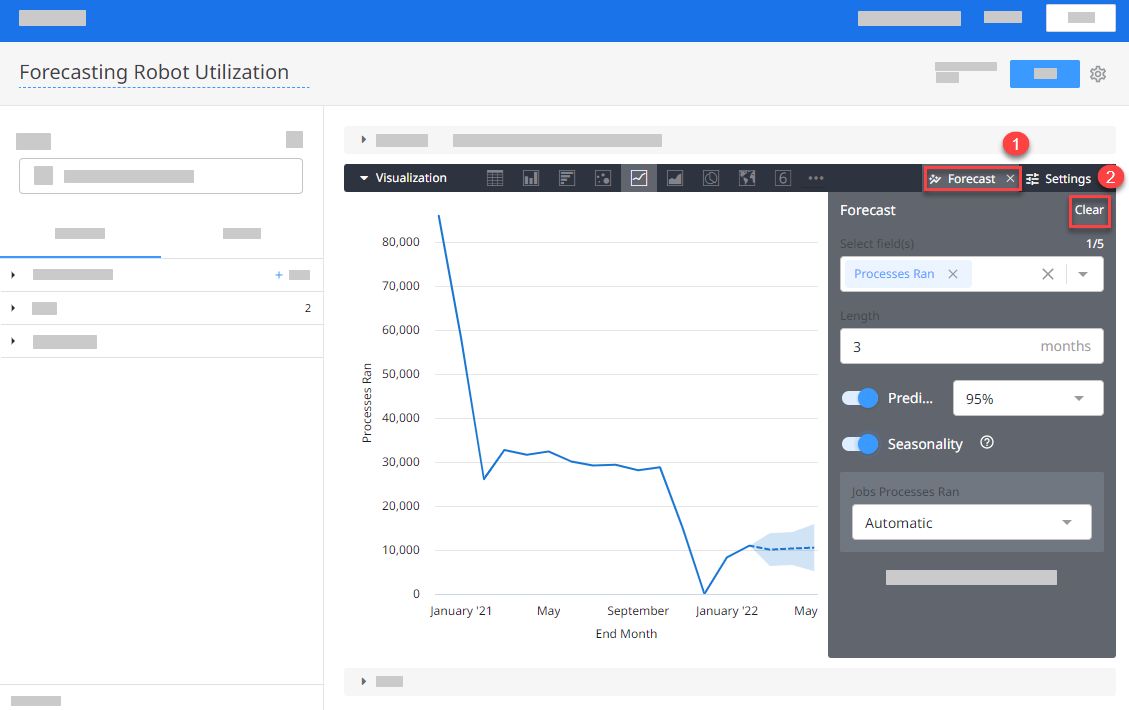
5. Navigate to **Visualization** > **Forecast** to change forecasting settings.
6. Select **Clear** to remove the forecast.
7. Save the dashboard.
## Related Articles
[Forecasting in visualization in Looker](https://docs.looker.com/exploring-data/visualizing-query-results/forecasting-in-visualizations)