# Efficiency - Automation
> Efficiency and automation opportunity analysis dashboard for the Order-to-Cash process in Process Mining standalone, showing automation rates and event execution costs.
## Introduction
The dashboard **Efficiency – Automation** can be used to find automation opportunities in the process. For the selected attribute the **Automation rate** is displayed by default for the current period. The dashboard also displays information about the costs involved in the execution of an event which indicates the benefit of automating the event. See illustration below.

## KPIs
Below is a description of the **KPIs** that are displayed at the top of the **Efficiency - Automation** dashboard.
KPI
Description
Automation rate
The percentage of events that are automated. Note: If you click on the Automation rate KPI, the Automation rate metric is displayed in the What is the automation potential? dashboard item.
Total manual event cost
The total cost of executing the events that are not automated. Note: If you click on the Total manual event cost KPI, the Total manual event cost metric is displayed in the What is the automation potential? dashboard item.
Total manual processing time
The total amount of time actually spent working for the events that are not automated. Note: If you click on the Total manual processing time KPI, the Total manual processing time metric is displayed in the What is the automation potential? dashboard item.
### Metrics
Instead of the **Automation rate**, you can select the **Manual event cost**, or the **Manual processing time** as the main metric to be displayed on the dashboard. See illustration below.

## History graph
The **History** graph shows the metric values for the selected attribute over time. See illustration below.

Below is a description of the different metrics.
| Metric | Description |
| --- | --- |
| Automation rate | Percentage of events that is automated. |
| Total manual event cost | The total costs of executing the events that are not automated. |
| Total manual processing time | The total amount of time actually spent working for the events that are not automated. |
| Manual events | The total number of manual events. |
## Process graph
The process graph provides a visual representation of event costs related to the number of cases in the process. When hovering over an activity, next to the metrics are displayed in the hint. See illustration below.

When hovering over an edge, the average throughput time and the number of events are displayed in the hint. See illustration below.

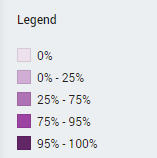
### Automation legend
The colors of the activities in the process correspond to the percentage of automated events for each activity. See illustration below.
## Submitting automation ideas
When you identify a bottleneck in the Order-to-Cash process while monitoring, for example when a manual activity takes a long time to be executed, you might want to send a request to automate the activity to **UiPath Automation Hub**. You can do this directly from the Process Graph. See [Sending Automation Ideas to UiPath Automation Hub](https://docs.uipath.com/process-mining/standalone/2021.10/user-guide/sending-automation-ideas-to-uipath-automation-hub#sending-automation-ideas-to-uipath-automation-hub) for more information.
:::note
This function is only available if **UiPath Process Mining** is set up for integration with **UiPath Automation Hub**.
:::