# Common Actions for Designers

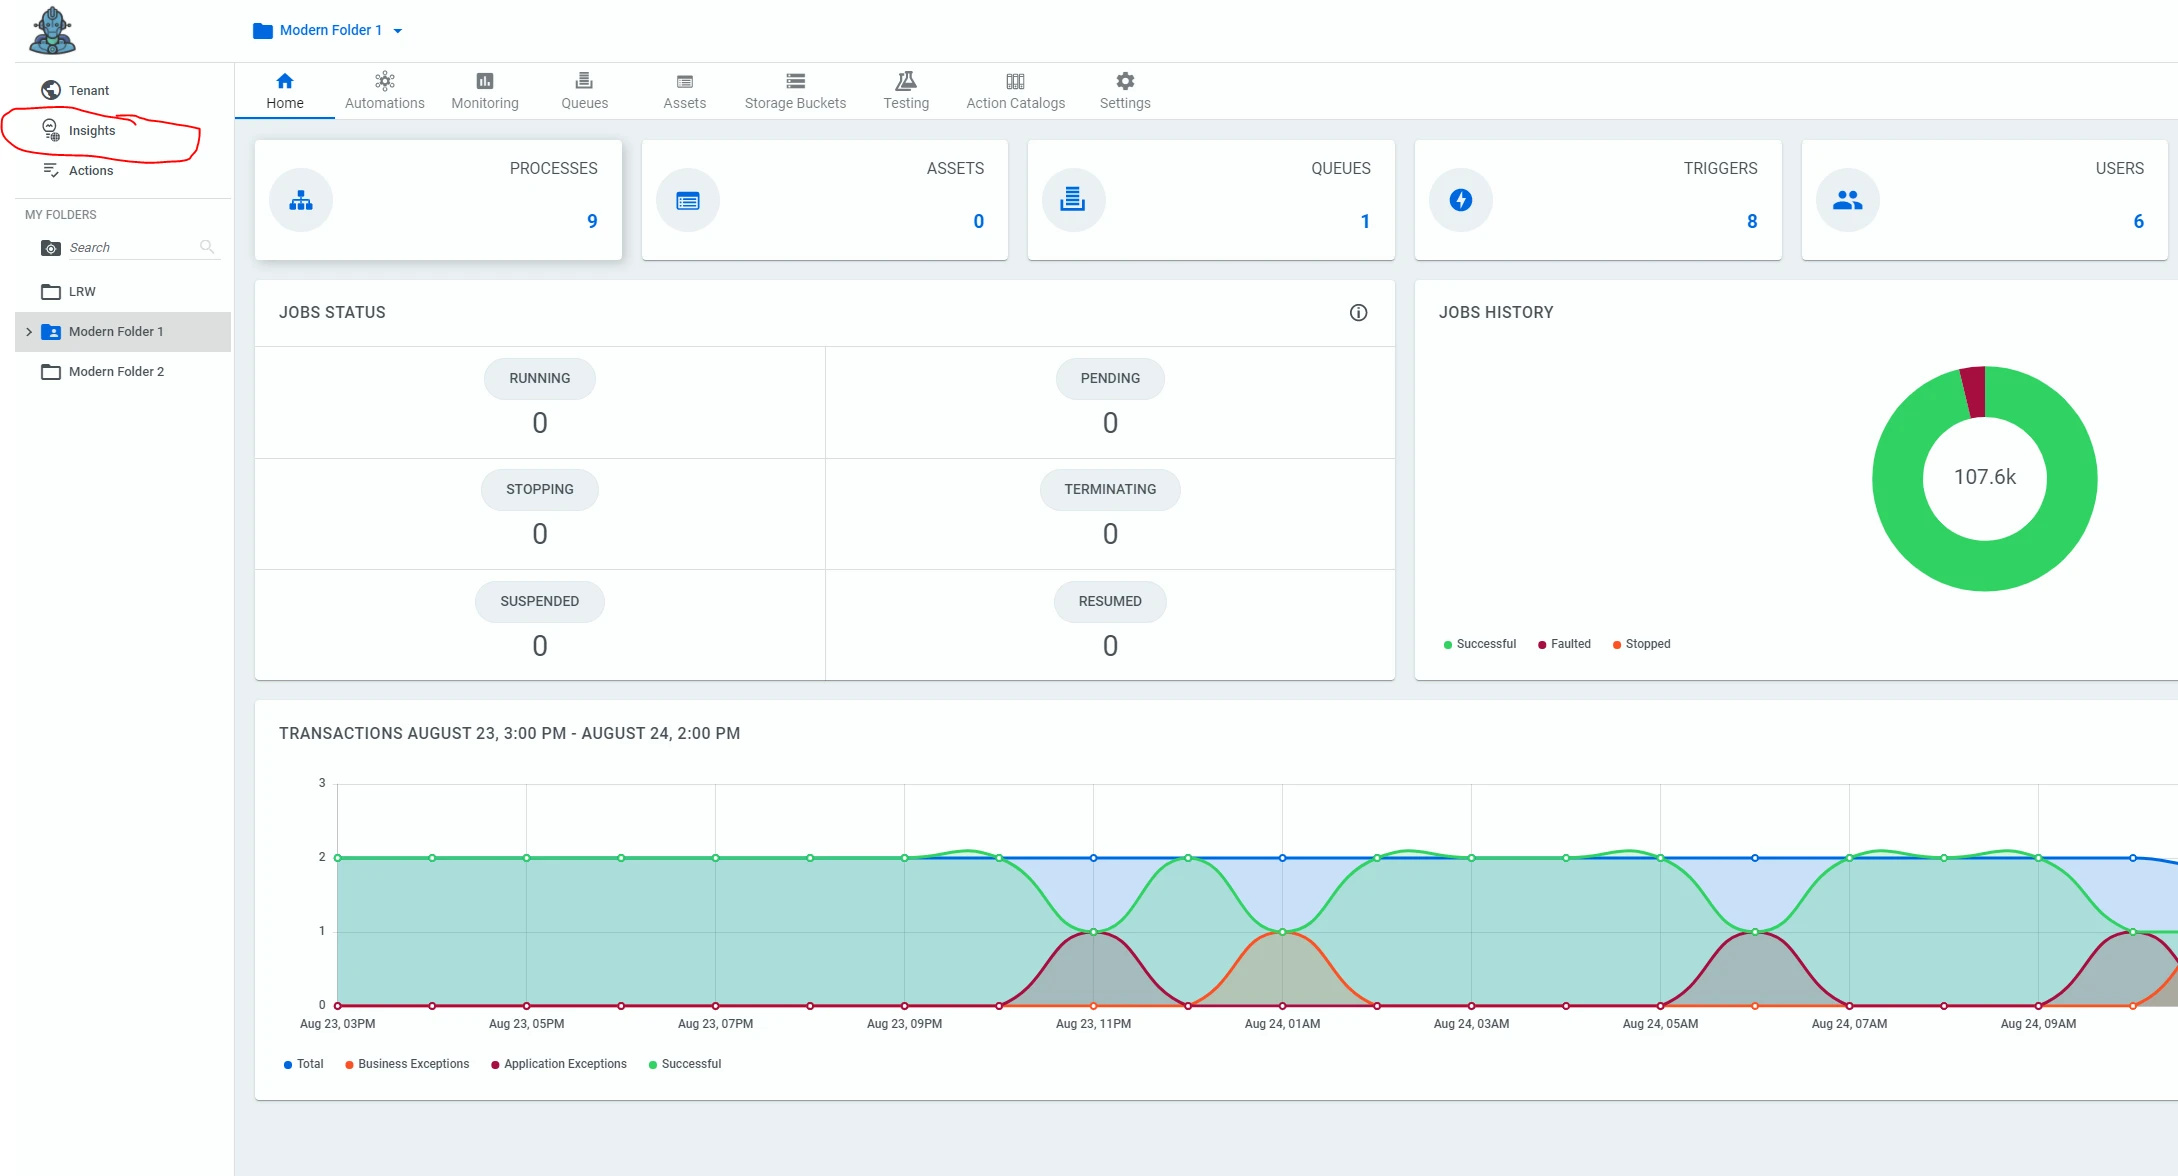
> * A user needs to select the **Insights** button in the left menu of Orchestrator to get to Insights.
## Prerequisites

### Prerequisite for Designers to Perform Actions in Insights &lt;2021.10

* A user needs to select the **Insights** button in the left menu of Orchestrator to get to Insights.

  ![Screenshot with the Insights button highlighted.](https://dev-assets.cms.uipath.com/assets/images/insights/insights-158288-4f0184ba.webp)

### Prerequisite for Designers to Perform Actions in Insights 2023.4

* Type in the Insights URL and log in.
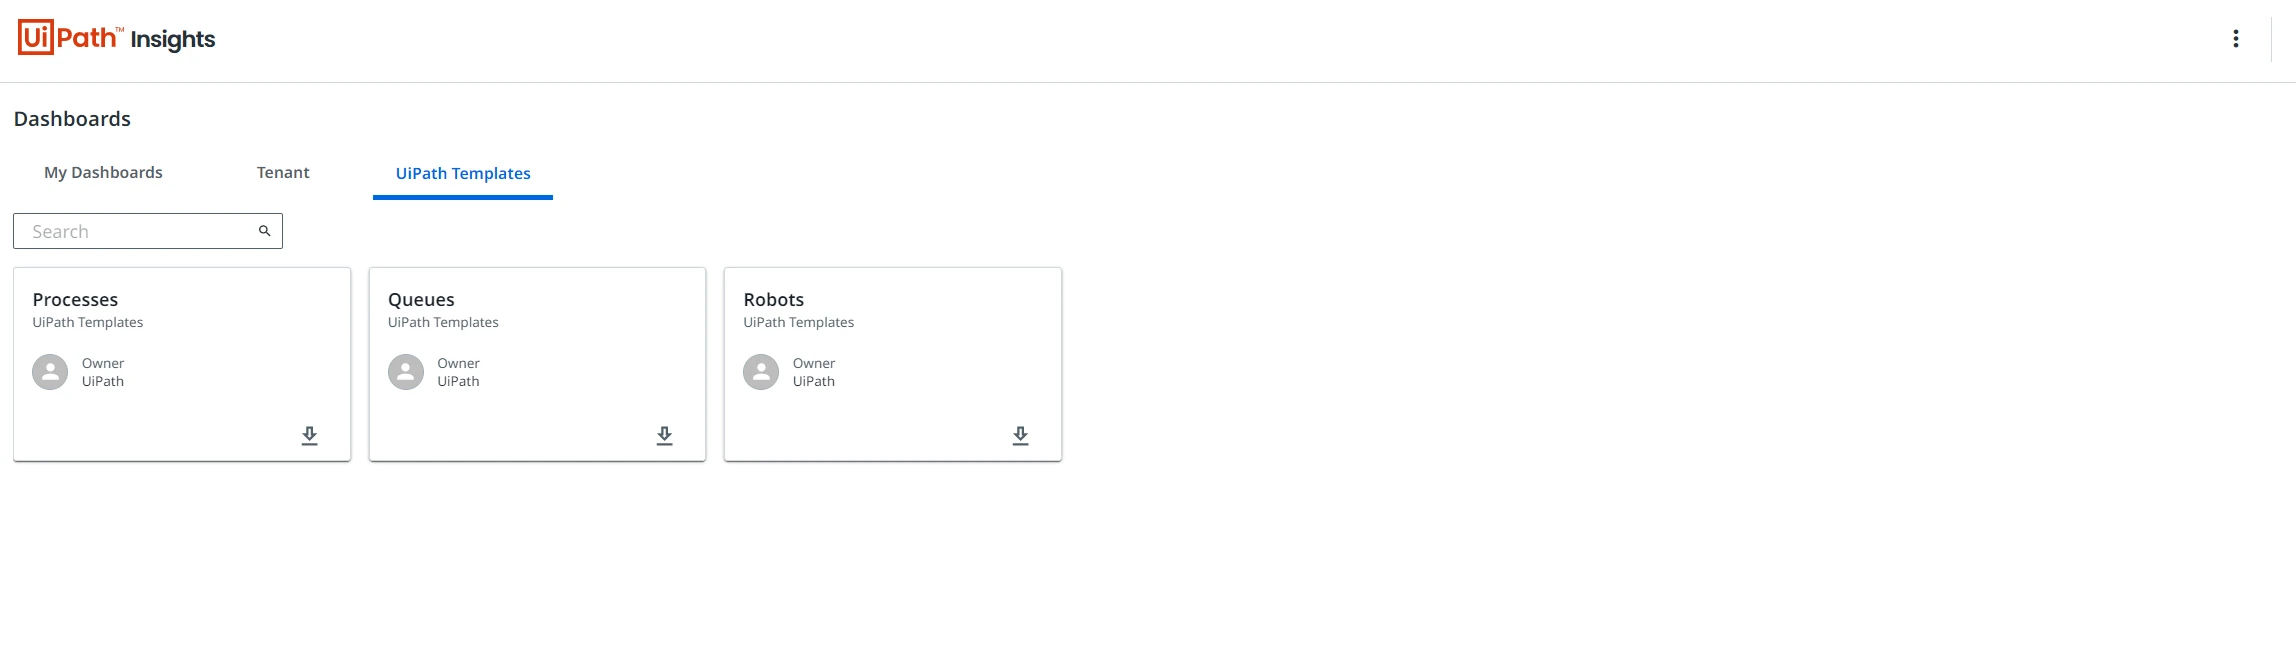
  ![Screenshot of the Insights homepage.](https://dev-assets.cms.uipath.com/assets/images/insights/insights-158641-05fb533e.webp)

## Comparison

<colgroup>
<col/>
<col/>
<col/>
</colgroup>

Action

Insights &lt;2021.10

Insights 2023.4

Set alerts (Anomaly detection)

Select the dashboard that has the metric
                                    									you want to set an alert for.
                                 

Select the Edit Dashboard button
                                    									on the dashboard to launch the Insights Portal.
                                 

In the Insights portal, select the
                                    										Options menu associated with the widget you want to
                                    									add an alert for.
                                 

Then select Add to Pulse.
                                 

You can adjust the name and the alert
                                    									condition. Select Automatic to add an alert using the
                                    									anomaly detection algorithm.
                                 

You can also select Advanced and
                                    									edit any of the other options. Here you can add a filter to the
                                    									metric.
                                 
Select the People tab and enter
                                    									the names, email addresses, or groups that you want to receive
                                    									the pulse notification.
                                 

Lastly, select the last tab to add a
                                    									message to the notification and choose how to notify the
                                    									users.
                                 

Anomaly detection
                                    									not available.
                                 

Set alerts (threshold)

Select the dashboard that has the metric
                                    									you want to set an alert for.
                                 

Select the Edit Dashboard button
                                    									(pencil icon) on the dashboard to launch the Insights
                                    									portal.
                                 

In the Insights portal, select the
                                    										Options menu associated with the KPI you want to add
                                    									an alert for.
                                 

Then select Add to Pulse.
                                 

You can adjust the name and the alert
                                    									condition. Select Threshold to choose to send an alert
                                    									using a threshold and set the condition for the alert.
                                 

You can also select Advanced and
                                    									edit any of the other options. Here you can add a filter to the
                                    									metric.
                                 

Select the People tab and enter
                                    									the names, email addresses, or groups that you want to receive
                                    									the pulse notification.
                                 

Lastly, select the Wi-Fi symbol to add a
                                    									message to the notification and choose how to notify the
                                    									users.
                                 

To set an alert,
                                    									navigate to the dashboard that you want to set an alert
                                    									for.
                                 

Hover over the
                                    									tile that you want to add an alert for.
                                 

Select the tile’s bell icon to set an
                                    									alert.
                                 

Now you can
                                    									choose the exact threshold and condition to trigger the
                                    									alert.
                                 

Then add the emails to send the alert to
                                    									and edit the frequency. The frequency sets how often Insights
                                    									will check the data for changes (and to send an alert
                                    									notification if the alert conditions are met). Then select
                                    										Save.
                                 

Set alerts (Always alert)

Select the dashboard that has the metric
                                    									you want to set an alert for.
                                 

Select the Edit Dashboard button
                                    									(pencil icon) on the dashboard to launch the Insights
                                    									portal.
                                 

In the Insights portal, select the
                                    										Options menu associated with the KPI you want to add
                                    									an alert for.
                                 

Then, select Add to Pulse.
                                 

You can adjust the name and the alert
                                    									condition. Select Always to choose to send an alert after
                                    									each build regardless of if the value has changed.
                                 

You can also select Advanced and
                                    									edit any of the other options. Here you can add a filter to the
                                    									metric.
                                 

Select the People tab and enter
                                    									the names, email addresses, or groups that you want to receive
                                    									the pulse notification.
                                 

Lastly, select on the Wi-Fi symbol to add
                                    									a message to the notification and choose how to notify the
                                    									users.
                                 

Always alerts not
                                    									available.
                                 

Create Dashboard

Select Create dashboard to create
                                    									a new dashboard.
                                 

If you are already in the Insights
                                    									Portal, select the Options button.
                                 

Lastly, name the dashboard and select
                                    										Create.
                                 

Select Create New Dashboard to
                                    									create a new dashboard.
                                 

Then, choose a name for your dashboard
                                    									and select Save.
                                 

Edit Dashboard

You can also edit a dashboard by selecting the pencil icon on the dashboard when it is opened
                                    									in Orchestrator, which will launch the dashboard in edit mode in
                                    									the Insights portal.

Select the More Actions button on
                                    									the dashboard that you would like to edit.
                                 

Select Edit
                                       										Dashboard, and then you can edit the dashboard in the
                                    									Insights Portal.
                                 

To edit a dashboard, first select the
                                    									dashboard you want to edit.
                                 

Select the three-dot dashboard actions
                                    									menu on the top right side of the dashboard.
                                 

Then, select Edit Dashboard.
                                 

Edit A Tile

Select the More Actions button
                                    									next to the dashboard that you would like to edit.
                                 

Then select
                                    										Edit Dashboard.
                                 

Then, select the Edit Widget
                                    									button (pencil) on the widget you would like to edit.
                                 

Optionally, you can edit a widget by
                                    									first selecting the dashboard, and then selecting the pencil on
                                    									the widget you would like to edit.
                                 

Lastly, if you are inside the Insights
                                    									Portal, select the dashboard that contains the widget you want
                                    									to edit.
                                 

Then, select the pencil on the widget you
                                    									would like to edit.
                                 

To edit a tile,
                                    									first select the dashboard you want to edit.
                                 

Select on the three-dot dashboard actions
                                    									menu on the top right side of the dashboard.
                                 

Select Edit Dashboard.
                                 

Now you can edit a tile. Select the
                                    									three-dot menu on any specific tile, and then select
                                    									Edit.
                                 

Now you can edit the tile and, finally,
                                    									select Save.
                                 

Copy templates

Select the More Actions button
                                    									next to the default dashboard that you would like to edit to
                                    									enter the Insights Portal.
                                 

Open the folder
                                    									that contains the shared default dashboards.
                                 

Select the default dashboard that you
                                    									want to copy.
                                 

Select the More Actions menu and
                                    									then Duplicate.
                                 

Optionally, you can also hover over the
                                    									default dashboard that you would like to copy and select the
                                    										More Actions button.
                                 

Select
                                    										Duplicate to create a copy of the dashboard
                                 

To copy a
                                    									template, navigate to the UiPath Templates tab.
                                 

Select the Copy button to copy the
                                    									template.
                                 

Give the new dashboard a title and select
                                    										Save.
                                 

Copy dashboard

Select the More Actions menu next
                                    									to the dashboard that you would like to copy. Then select
                                    										Edit to enter the Insights portal.
                                 

Select the dashboard you want to
                                    									copy.
                                 
Select the Options menu on the
                                    									dashboard and then Duplicate.
                                 

Optionally, you can also hover over the
                                    									dashboard that you would like to copy and select the More
                                       										Actions button.
                                 

Select
                                    										Duplicate to create a copy of the dashboard.
                                 

To copy a
                                    									dashboard, navigate to the desired dashboard tile.
                                 

Select the Share/Duplicate
                                    									button.
                                 

Select Duplicate to make a
                                    									copy.
                                 

Export dashboard (as <code>.dash</code>
                                 								file)
                              

Select the More Options menu next
                                    									to the dashboard that you would like to export. Then select
                                    										Edit to enter the Insights portal.
                                 

You can export this dashboard by
                                    									selecting the Options menu button in the upper
                                    									right.
                                 

Select Export.
                                 

Optionally, you can also select the
                                    										More Actions button on the dashboard that you would
                                    									like to export as a <code>.dash</code> file.
                                 

Then select Export.
                                 

Cannot currently
                                    									export a dashboard as a <code>.dash</code> file.
                                 

Import a dashboard (as <code>.dash</code>
                                 								file)
                              

Once inside the Insights portal, select
                                    									the Options ( +) button.
                                 

Then select
                                    										Import dashboards.
                                 

Locate the file path of where the
                                    									dashboard was saved as a .dash file, and then select
                                    									Open.
                                 

Then select OK to import the
                                    									dashboard.
                                 

Cannot currently


Forecasting

Once inside the Insights Portal, select
                                    									the dashboard that contains the widget you want to add
                                    									forecasting to.
                                 

Select Edit on the widget that you
                                    									want to add forecasting to.
                                 

To add forecasting to the visualization,
                                    									duplicate the value that you would like to forecast. To do so,
                                    									select the More Options button and select
                                    										Duplicate.
                                 

If a break-by is set on the widget, make
                                    									sure to delete it by selecting the Delete button.
                                 

Select the settings menu next to the
                                    									copied value, and select Regression.
                                 

You can choose the regression that fits
                                    									to the chart. select Save, and it will get applied.
                                 

To add
                                    									forecasting to a dashboard, navigate to the desired dashboard
                                    									tile.
                                 
Select Edit on the widget that you
                                    									want to add forecasting to. You can only add forecasting to the
                                    									following visualization types: Column, Bar, Scatterplot, Line,
                                    									and Area. You can support rendering forecasted data to the
                                    									following text and table charts: Table, Table Legacy, Single
                                    									record, and Word Cloud.
                                 
To add
                                    									forecasting to the visualization, make sure you have exactly one
                                    									timeframe dimension with dimension fille enabled. Also, include
                                    									at least one measure or custom measure (a forecast can include
                                    									up to five measures).
                                 
Select the forecasting button to add
                                    									Forecasting. Then select the Select Field's drop-down to select
                                    									the measure that you want to add forecasting to. Add the Length
                                    									to include the length of time for which to forecast data
                                    									values.
                                 
Lastly, select Run to see the forecasted
                                    									results.
                                 

Exploration paths

Once inside the Insights Portal, select
                                    									the dashboard that you would like to add an exploration path
                                    									to.
                                 

Then select the Options button on
                                    									the dashboard and then Exploration Paths.
                                 

Then, exploration
                                    									paths will be enabled for all users of this dashboard, and the
                                    									dashboard will refresh.
                                 

Exploration paths
                                    									are not available.
                                 

Delete dashboard

Once inside the Insights Portal, select
                                    									the dashboard that you would like to delete.
                                 
Then select the Options button on
                                    									the top right of the dashboard, and then choose Delete
                                       										Dashboard.
                                 

Optionally, you can hover over the
                                    									dashboard in the left dashboard pane, and select the More
                                       										Actions button and then Delete.
                                 

Locate the dashboard in the My
                                       										Dashboards or Tenant tab and select the
                                    										Delete button.
                                 

Optionally, select the specific dashboard
                                    									you want to delete.
                                 

Then, select the dashboard actions menu
                                    									in the top-right corner of the dashboard, and select Move to
                                       										Trash. Lastly confirm the deletion by selecting Move
                                       										to trash.
                                 

Dashboard schedules

Once inside the Insights Portal, select
                                    									the dashboard that you would like to schedule to be sent (this
                                    									is not applicable for the default dashboards). To schedule a
                                    									default dashboard, first make a copy of it.
                                 
Select the Share button.
                                 

Enter the names,
                                    									email addresses, or groups that you want to share the report
                                    									with.
                                 

Choose whether
                                    									you want to send the dashboard as an email report or a
                                    										<code>.pdf</code> attachment. Then modify the time zone
                                    									and the recurrence to send the dashboard.
                                 

Optionally you can select the More
                                       										Actions button next to the dashboard in the dashboard
                                    									pane and then Share.
                                 

Enter the names,
                                    									email addresses, or groups that you want to share the report
                                    									with.
                                 

Choose whether
                                    									you want to send the dashboard as an email report or a
                                    										<code>.pdf</code> attachment. Enter the frequency and
                                    									time at which email reports are sent.
                                 

To schedule a
                                    									dashboard, first open the dashboard you would like to
                                    									schedule.
                                 

Select the dashboard actions menu in the
                                    									top-right corner of the dashboard and then select Schedule
                                       										Delivery.
                                 

Select the
                                    									recurrence, time, email addresses, and format. You can send
                                    									reports to any email address, even to users with no Insights or
                                    									Orchestrator access.
                                 

You can also add
                                    									more filters.
                                 

Lastly, you can add a custom message,
                                    									edit the paper size, and the delivery time zone. Then select
                                    										Save.
                                 

Share a dashboard with another user inside the
                                    									product

Once inside the Insights Portal, select
                                    									the dashboard that you would like to share.
                                 
Select the Share button on the
                                    									dashboard.
                                 

Enter the names
                                    									that you would like to share the dashboard with. You can also
                                    									give the user the right to view, edit, or own the
                                    									dashboard.
                                 

Select Save and the dashboard will
                                    									be shared.
                                 
Optionally, select the More
                                       										Actions button next to the dashboard that you want to
                                    									share.
                                 

Select Share.
                                 

Enter the names
                                    									that you would like to share the dashboard with. You can also
                                    									give the user the right to view, edit, or own the
                                    									dashboard.
                                 

Select Save and the dashboard will
                                    									be shared.
                                 

You cannot share
                                    									a dashboard with one person directly inside of the product. You
                                    									can achieve this with scheduling a delivery.
                                 

Share a dashboard with everyone who has Insights
                                    									access on the tenant

Once inside the Insights Portal, select
                                    									the dashboard that you would like to share.
                                 
Select the Share button on the
                                    									dashboard.
                                 

Enter the group
                                    									called Everyone to share the dashboard with everyone. To
                                    									share with all users and groups that have Viewer permissions,
                                    									enter <code>[Tenant Name]-Consumer</code>. To share with all
                                    									users and groups that have Designer permissions, enter
                                    										<code>[Tenant Name]-Editor</code>.
                                 

Select Save, and the dashboard
                                    									will be shared
                                 
Optionally, select the More
                                       										Actions button next to the dashboard that you want to
                                    									share.
                                 

Select Share.
                                 

Enter the group
                                    									called Everyone to share the dashboard with everyone. To
                                    									share with all users and groups that have Viewer permissions,
                                    									enter <code>[Tenant Name]-Consumer</code>. To share with all
                                    									users and groups that have Designer permissions, enter
                                    										<code>[Tenant Name]-Editor</code>.
                                 

Select Save, and the dashboard
                                    									will be shared.
                                 

To share a dashboard with everyone who
                                    									has access on the tenant, first locate the dashboard you want to
                                    									share in the My Dashboards tab and select the
                                    										Share/Duplicate button.
                                 

Select Share with Tenant to share
                                    									the dashboard with the tenant.
                                 

Create folders for dashboard sorting

Once inside the Insights Portal, select
                                    									the Options button in the Dashboards pane.
                                 

Select New Folder.
                                 

Edit the name for the new folder and then
                                    									select the green check to save the folder.
                                 

To add a dashboard to the folder, select
                                    									the More Actions button next to the folder and then
                                    										New Dashboard.
                                 

Creating folders
                                    									for dashboard sorting is not currently available.
                                 

Add filter to custom dashboard

From the Insights portal, select the
                                    									dashboard that you want to add a filter to.
                                 

On the right side of the dashboard,
                                    									select the Options button in the filters pane.
                                 

Add the filter you want to the dashboard
                                    									and select OK.
                                 

Navigate to the
                                    									dashboard that you want to add a filter to.
                                 

Then, edit the
                                    									dashboard.
                                 

Now you can add a filter to the
                                    									dashboard. select Filters and then Add
                                       									Filter.
                                 

Add the field you
                                    									want to filter the dashboard with.
                                 

Edit the title
                                    									for the filter, the way the filter is presented, and the
                                    									values.
                                 

Lastly, choose which tiles should be
                                    									filtered by this new field and select Add.
                                 

Process baselines/ROI dashboard

Once inside the Insights Portal, select
                                    									the Business ROI Dashboard under the OOTB folder.
                                 
Make a copy of
                                    									this to own it locally.
                                 

Scroll to the Process Baselines
                                    									widget and select Edit. From the Design menu,
                                    									select the Tabular radio button. Enter the corresponding
                                    										Manual Time(min) and Hourly Cost values for
                                    									all processes. You can also add in more custom columns and
                                    									lastly select Apply to confirm and save your
                                    									changes.
                                 

To access
                                    									anything related to the ROI Dataset, you will also need ROI
                                    									editor permissions. First, make a copy of the Business ROI
                                    									template.
                                 

Then edit the
                                    									dashboard itself.
                                 

Add a visualization tile or open up an
                                    									existing tile. select the Process Manual Values or
                                    										Queue Manual Values explore.
                                 

Suggested fields when building widget

Once inside the
                                    									Insights Portal, edit a dashboard or create a new
                                    									dashboard.
                                 
Select the Add Widget button.
                                 

Here you can see
                                    									the suggested fields when building a widget.
                                 

Not available in Insights 2023.4.

Building a dashboard with custom fields from Robot
                                    									Logs and Queues

Once inside the
                                    									Insights Portal, create a new dashboard or edit an existing
                                    									one.
                                 

Select Select Data and choose the
                                    									available tenant data source.
                                 

Custom variables
                                    									that have been added via the Add Log Fields activity are
                                    									found in a new table created in Insights containing those custom
                                    									fields with the title Process- &lt;your process name&gt;.
                                    									These custom fields are extracted from the raw message and added
                                    									to the table in the <code>RawMessage_CustomfieldName</code>
                                    									format. Locate the process to see the custom variables.
                                 

If custom fields
                                    									are detected by Insights in a queue, a custom table is created
                                    									in the data model called Queue-&lt;your queue name&gt;.
                                    									The fields will be identified via the input they were stored
                                    									in:
                                 
Custom variables
                                    									that have been added via the Add Queue Item in the
                                    									ItemInformation property will be named
                                    										SpecificData_&lt;yourfieldname&gt;.
                                 
Custom variables
                                    									that have been added via the Set Transaction Status
                                    									activity are found in AnalyticsData_&lt;yourfieldname&gt;
                                    									if they were stored under the analytics property, or
                                    										Output_&lt;yourfieldname&gt; if they were stored
                                    									under the Output property.
                                 

Navigate to the
                                    									dashboard that you want to add custom variables to or create a
                                    									new dashboard.
                                 
Edit the
                                    									dashboard.
                                 
Then add a new
                                    									tile.
                                 
Choose the explore that contains the
                                    									custom variable you want to use. All extracted variables for a
                                    									specific Process should appear in an explore named Process -
                                    									ProcessName, and all extracted variables for a specific Queue
                                    									should appear in an explore named Queue- QueueName.
                                 

In the ProcessName view, you can select
                                    									the custom fields that were extracted.
                                 

Add value labels to visualizations

Once inside the Insights Portal, select
                                    									the dashboard with the visualizations that you want to add value
                                    									labels to.
                                 

Select the Edit button next to the
                                    									desired widget.
                                 

Turn on the value label for the widget
                                    									and select Apply.
                                 

You can add total values where the values
                                    									appear at the top of each column or relative values where the
                                    									values are broken down.
                                 

Navigate to the
                                    									dashboard that you want to add value labels to the
                                    									visualization.
                                 

Edit the
                                    									dashboard.
                                 

Then edit the
                                    									tile you want to add value labels to.
                                 

Select the Edit/Gear icon and
                                    									navigate to the Values tab.
                                 

Turn on value labels by selecting the
                                    									text that says <code>Value Labels</code> and then select
                                    										Save.
                                 

Add title to widget

Once inside the Insights Portal, select
                                    									the dashboard with the widget that you want to add a title to,
                                    									or create a new widget in.
                                 
To add a title for a new widget, create a
                                    									new widget and then add the title.
                                 

To edit the title of an existing widget,
                                    									select the pencil icon next to the widget.
                                 

Select the current name and replace it
                                    									with the name you desire and select Apply.
                                 

To add a title to
                                    									a tile, first navigate to a dashboard and edit the
                                    									dashboard.
                                 

Add a new tile as
                                    									a visualization.
                                 

Choose the
                                    									explore you want to use for your visualization.
                                 
Replace the word
                                    										<code>Untitled</code> with the new title you want to
                                    									use.
                                 

To replace an existing tile’s title,
                                    									navigate to the dashboard, edit the dashboard, and edit the
                                    									tile. select the tile’s title, replace the text, and select
                                    										Save.
                                 

Add description to widget

Once inside the Insights Portal, select
                                    									the dashboard that you want to add a widget’s description
                                    									to.
                                 
To edit a description of an existing
                                    									widget, select the pencil next to the widget.
                                 
Select the information button and start
                                    									typing a description.
                                 

Select Apply to save the
                                    									changes.
                                 

To add a
                                    									description to a tile, fist navigate to the dashboard where the
                                    									tile occurs. Then edit the dashboard.
                                 

Select the three-dot button (Edit
                                       										Tile button) on the tile and then select Add
                                       									Note.
                                 

Enter the description you want in the
                                    									note text field and adjust the display location. Select
                                    										Add.
