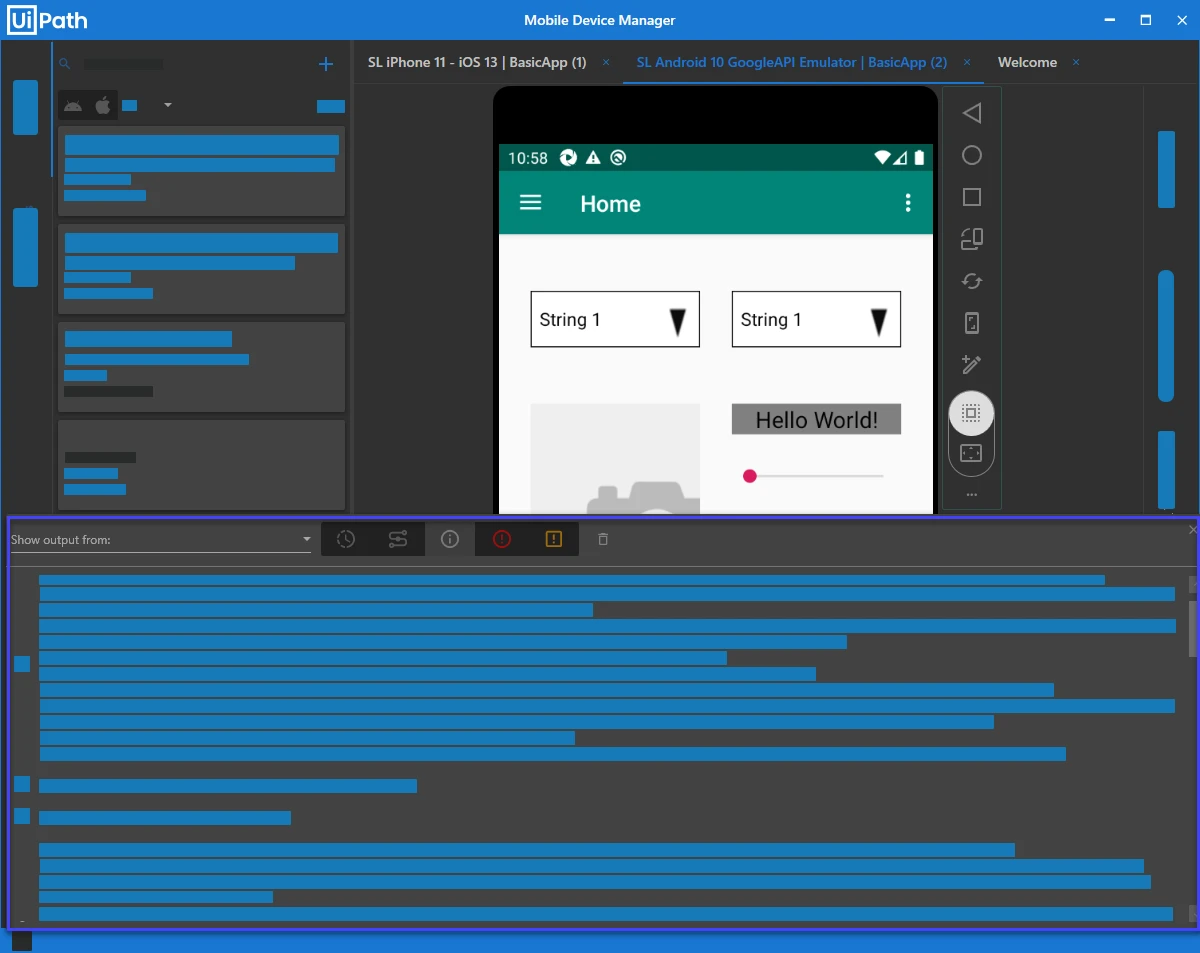
# Debugging
> Examine Appium logs and inspect elements on your device to better understand what has happened during automation.
Examine Appium logs and inspect elements on your device to better understand what has happened during automation.
## Debug tool
Use the debug tool to dig into the details of your automation, examining the Appium log output. For example, you might be
needing to have a look at low-level server logs to understand what has happened during the executed operations. You can then
hover your mouse over an event to see full details (e.g. determine when the connection was created, or when the test had started).
To open the debug panel:
1. [Start an application in Mobile Device Manager](https://docs.uipath.com/activities/other/latest/ui-automation/device-interaction#device-interaction).
2. Click the **Debug Tool** button to expand the panel details.
3. Click **Log Type** and select an option from the dropdown.
4. Click **Get Logs**.
5. (Optional) Click **Live Log** to retrieve events in real-time.
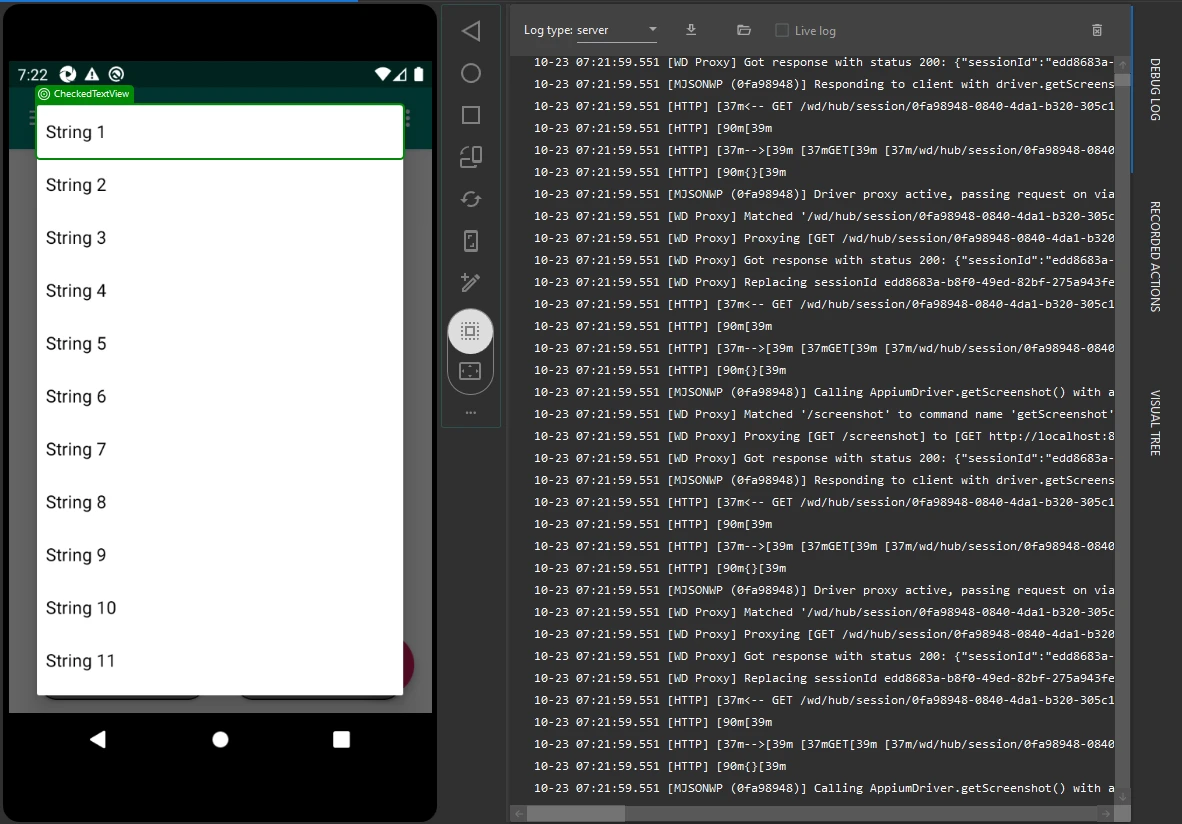
Logs Path
To configure a location for your logs, open MDM and navigate to **Project Setting** > **Project Level Settings** > **Logs Path**. Consider setting the log path to a shared network drive to expand member access to resources.
Log Types
You can get one of the following log types, depending on your requirements.
| iOS | Android |
| --- | --- |
| **syslog**: Device logs. | **server**: Appium server logs. |
| **crashlog**: Crash logs. | **logcat**: Device logs. |
| **performance**: Information about the iOS performance on the device. | |
| **server**: Appium server logs. | |
| **safariConsole**: Safari console logs. | |
| **safariNetwork**: Network requests. | |
Working With Debugging Logs
The following table lists the actions that you can take to manage your debugging logs.
Action
Description
Procedure
Get Logs
Retrieve logs.
Start an application in Mobile Device Manager and go to Debug Tool . Click Log Type and choose an option from the dropdown. Click Get Logs to retrieve.
Open File Location
Open the location where log is stored.
Follow the Get Logs procedure and click Open File Location .
Live Log
Retrieve events to your log in real-time.
Android: log cat
Clear
Clear the current view.
Follow the Get Logs procedure and click Clear to remove the log. Alternatively, you can get a different log to clear the panel and move to the next debugging step.
## Visual tree tool
Use the visual tree tool to view how the page looks like or to see elements that can potentially be automated.
To open the visual tree panel:
1. [Start an application in Mobile Device Manager](https://docs.uipath.com/activities/other/latest/ui-automation/device-interaction#device-interaction).
2. Click the **Visual Tree** button to expand the panel details.
3. Click **Inspect Element** and then click any element on your device.
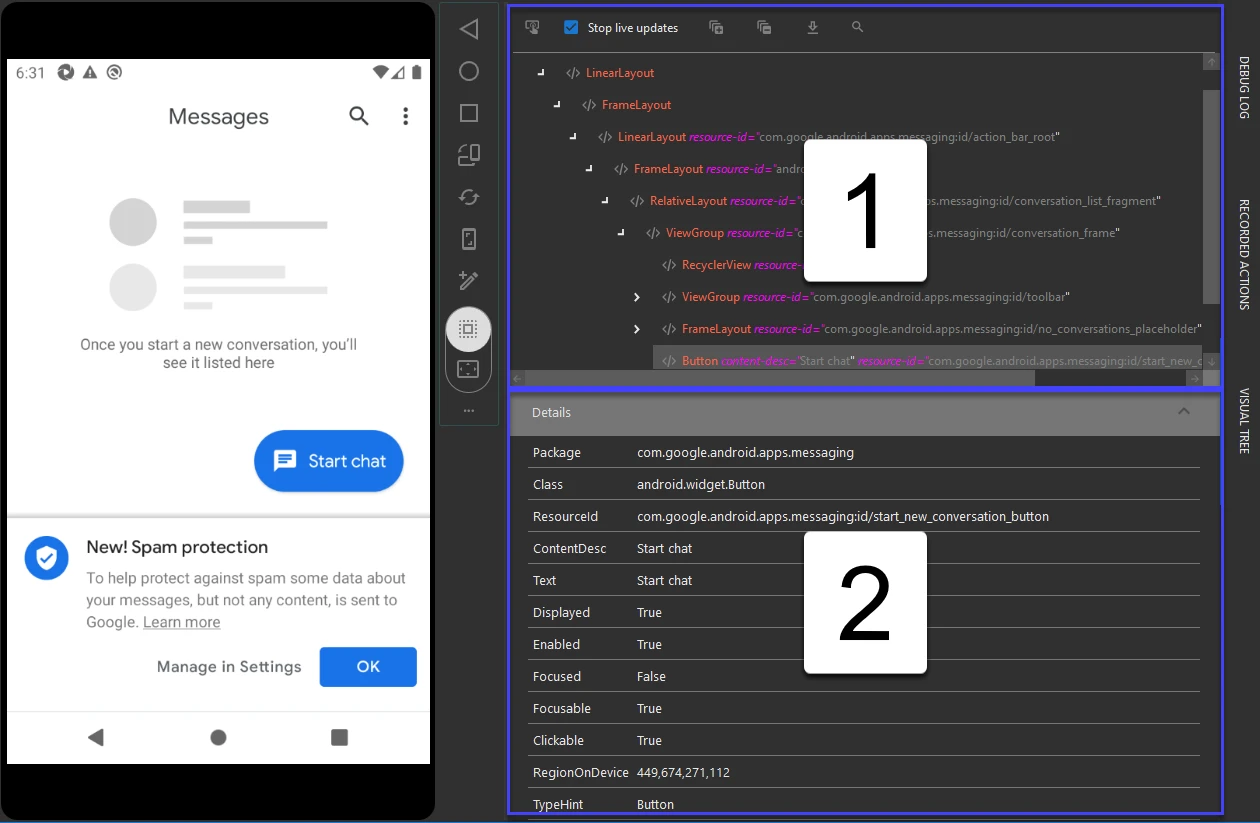
The element information is divided into two parts:
* In the 1st border frame, you can look for the tree structure of your elements. Hover the mouse over an entry to highlight
its corresponding element on the device.
* In the 2nd border frame, you can view element details. The information from this panel changes whenever you use the search
function.
Working With Visual Tree
The following table lists the actions that you can take to view the inspected elements.
Action
Description
Procedure
Inspect Element
Inspect elements on the device.
Start an application in Mobile Device Manager and go to Visual Tool . Click Inspect Element and click any element on your device.
Stop Live Updates
Stop receiving element info. This option is activated as soon as you click an entry in the tree structure panel.
To uncheck this option you must first use the Inspect Element tool. Start an application in Mobile Device Manager and go to Visual Tool . Click Stop Live Updates .
Expand All
Expand all elements.
Start an application in Mobile Device Manager and go to Visual Tool . Click Expand All .
Collapse All
Collapse all elements.
Start an application in Mobile Device Manager and go to Visual Tool . Click Collapse All .
Export Page Source
Export the page source as an XML file.
Start an application in Mobile Device Manager and go to Visual Tool . Click Export Page Source . Select a location and click Save to confirm.
Search
Search for element details.
Start an application in Mobile Device Manager and go to Visual Tool . Click Search and enter a term. You can view the results dynamically, as you type in the Details panel.
Working With Status
You can open the status panel to glance over events such as connection info, error messages, and statuses. To open the status
panel, click the hamburger button at the bottom-right of Mobile Device Manager.